During 2013 I've spent a lot of time playing and attempting to analyse F2P mobile games.
Part of what I've learned has been announced weekly in our Monetizer columns, which usually focus on the in-game economy of one game.
Other conclusions only become apparent over a longer period, however, and that's been the case with one part of our Monetizer process.
How it works
Called the Discounted Currency ratio, this is a measure of how much a unit of in-game currency costs per dollar spent at the different IAP transations available.
In almost all cases, the Discounted Currency ratio increases with IAP price i.e. you get more units of in-game currency per dollar spent if you spend $99.99 than if you spend $0.99.
This is an inherent encouragement for players to spend as much money as possible as they will get more in-game currency if they make one $49.99 purchases compared to 10 $4.99 purchases.
For that reason, the Discounted Currency ratio as used in this research is the difference between the in-game currency gained per dollar spent at a game's maximum IAP transaction (typically $99.99) compared to that at the minimum transaction (typically $0.99, $1.99 or $4.99).
We can see how the simple calculation works in the case of Clash of Clans.
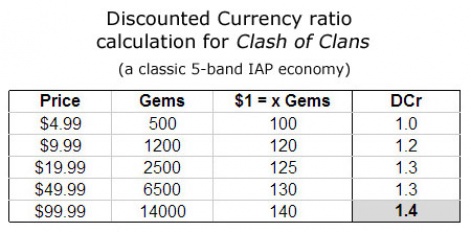
A classic 5-band IAP economy, you get 100 gems per $1 spent at the minimum transaction but 140 gems per $1 spent at the maximum.
In this way, we define Clash of Clan's DRc as being 1.4.
The main trends
The first graph is a data dump of the 50-or so games I've analysed, which shows the DRc is typically between 1 to 2, usually around 1.5-1.7.
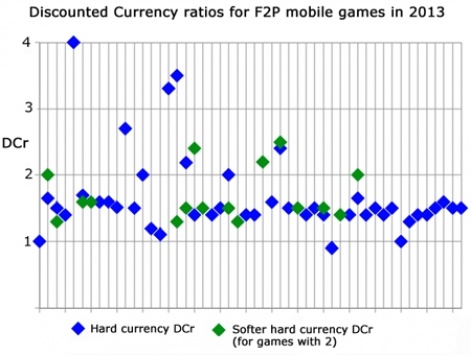
I've not included the games' titles (it's irreverent at this point), but need to point out that the graph is ordered in terms of a rough chronology with games released in 2012 or early 2013 on the far left hand side, with the newest games towards the right hand side of the graph.
(The 'date' in this case is when the games were analysed not when they were released, but it's roughly the same thing.)
As can be seen, most games have a single hard currency (a currency you buy with real cash), and hence are represented by a single blue dot.
Some games have two hard currencies, though. In that case, the DCr of the 'softer' of the two hard currencies is shown in green.
On this basis, we can see that a fairly strong trend has been for the volatility of DCr to decrease during 2013.
In terms of trends, there are no games with Discounted Currency ratios of more than 2 in the right hand third of the graph. All the high numbers - certainly anything over 3 - is towards the left hand side of the graph.
This suggests a growing consensus within the industry as it looks at what works and what doesn't.
(Of course, we need to point out that this is not a large or representative sample of the F2P mobile games released in 2013. It isn't random, however, as the games analysed are the high profile titles from the most high profile developers and publishers.)
A more subtle note is that over time, fewer games have two hard currencies.
Double trouble
In this context, it's interesting to consider those games that do have two hard currencies.
As can be clearly seen, some of them have the same DCr for both currencies (a green/blue dot), while others have very different ratios; something that highlights the fact there was little industry consensus on whether operating two hard currencies in a game is a sensible decision.
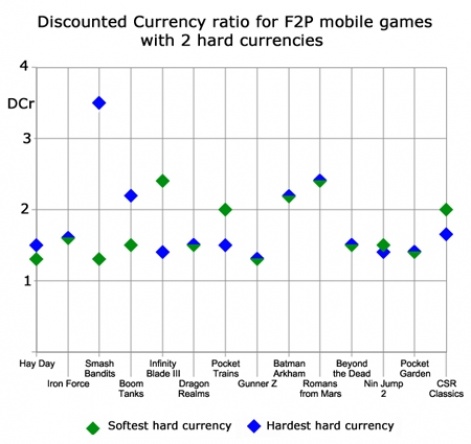
Indeed, it's interesting to see the confusion is such that some games more heavily discount the harder of the hard currencies (i.e. the blue dot is higher than the green dot), while other more heavily discount the softer of the two (the latter being the more logical in my opinion).
More generally, I personally think it's overly confusing (or off putting) for consumers to take this two hard currency approach, negating any monetisation benefit that can be gained from getting consumers to increase their in-app purchases frequency.
That is why having two hard currencies is becoming less common. In fact, the only successful game to use the system recently is CSR Classics, and that was only because that was system used in CSR Racing, which was released in 2012.
Compare and contrast
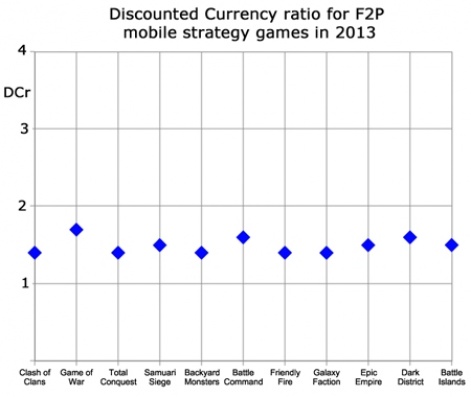
The final two graphs demonstrate how the Discounted Currency ratio can be used as a comparative measure.
The graph of mobile strategy games - games that I describe as the 'Clash of the Clones' for their similarities with Supercell's Clash of Clans - shows that within a genre with a dominant leader, all games will follow what has become a de facto standard.
This is something also discussed in relation to currency unit conversions here.
As can clearly be seen below, all these game have a single hard currency with a DCr of between 1.4 and 1.8.
The other graph compares the operational tactics of some of the larger companies in the space. Of course, the sample isn't large enough to be conclusive, but certain trends are obvious.
With no seeming pattern to its games' DCrs, EA Mobile seems to take a game-by-game approach, as do Gameloft and Kabam, albeit much more bounded with respect to DCr.
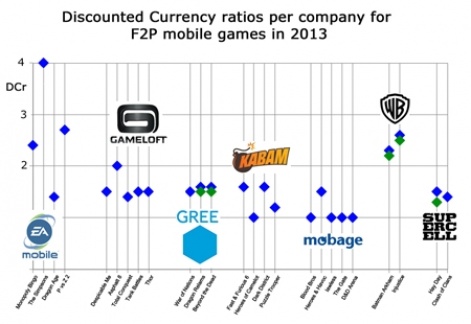
Click here for a larger image
As we'd expect, the two Japanese platform companies GREE and DeNA (Mobage) have a very strict approach; particularly Mobage which is a company that doesn't discount currency purchases at all (DCr = 1), apart from in one game (Heroes & Havoc).
Interestingly, Warner Bros. has two games which both have two hard currencies; and also which operate at a high DCr. Industry leader Supercell only has two games, but despite running both one and two hard currency titles, they both have a similar DCr.