Of course, it crunches big data, and it throws out actionable data that helps player acquisition, segmentation, retention, and ultimately life time value.
Who doesn't these days?
What's somewhat different, however, is it looks at this value proposition through the lens of user behaviour.
Again, this isn't new. We've had player types since the Bartle Test of Gamer Psychology in 1996, but things are obviously a lot more sophisticated now.
Define your terms
That's the background for Playnomics' Quarterly Player Engagement study.
Taking the data from "50 million social, casual and mobile players in the Playnomics game network" during Q1 2013, it looks to shed a light on the variation of behaviours in terms of game types, player types and geography.
One caveat to mention before we dive into it, however, is the company's split between arcade and non-arcade games.
Adding a seemingly self-selection bias into the data, Playnomics defines arcade games as those "intended to provide short-term and immediate entertainment."
Non-arcade games "often feature levels, campaigns and collectables".
Go figure.
I can see what the company is trying to do, but it feels artificial nevertheless.
That's more than a whale
Luckily, though, this division of game types doesn't matter in terms of our Chart of the Week.
For the scary conclusion of the survey that of 1.7 million players (of non-arcade games) tracked during Q1 2013, Playnomics reckoned that only 13,454 spent any money in-game - that's 0.77 percent.
The total revenue generated across all games was $590,239 and of that total, a mere 134 players accounted for 33 percent of that (or $192,874).
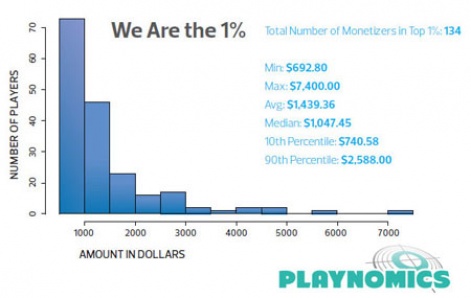
Of this 134 - roughly 1 percent of the total payer base - their minimum spend was $693, up to a maximum of $7,400.
Or put another way, this 1 percent of payers paid an average of $1,439 compared to an average of $44 across all payers (which includes the 1 percent).
You can delve more deeply into Playnomics Quarterly Player Engagement study here.