I'm a man who likes charts, which is why I'm in charge of our regular Chart of the Week feature.
It's an opportunity to cut back on the words and look at key market trends as represented by lines in a quadrant, or occasionally slices of pie.
So here are my favourite charts - and trends - of 2013.
10. Are you ready for the rise of India and Indonesia?
In October, mobile ad network InMobi took a look at which countries were generating the most iOS and Android app downloads.
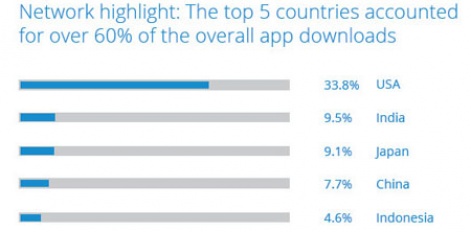
Surprisingly, India was ranked #2, with Indonesia ranked #5.
9. Chinese mobile advertising booms 151%
This market growth in southeast Asian markets hasn't gone unnoticed by Chinese game publishers.
According to PapayaMobile's Q3 Android Advertising Survey, Chinese companies are now the biggest spenders on its AppFlood network, with the value of campaigns up 151 percent between March and September.
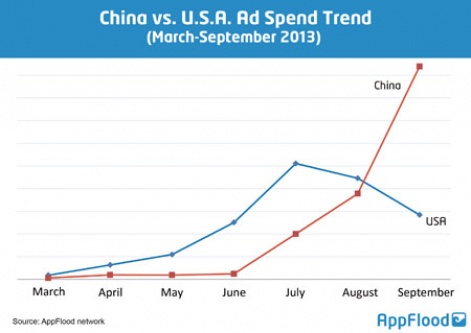
And the biggest slice of that money is being spent in Asia, followed by the Middle East.
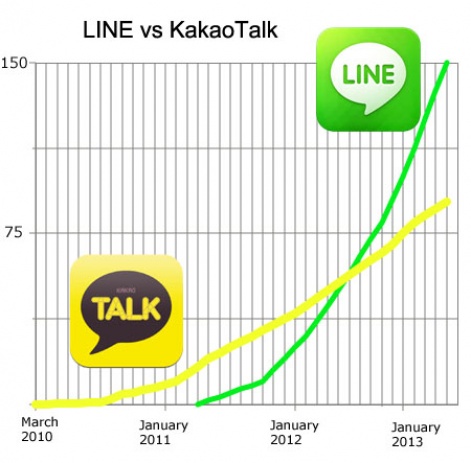
8. Is LINE or KakaoTalk growing faster?
One of the clear trends of 2013 was the growth in Asia of mobile messaging platforms; networks which developed into very strong app and game distribution businesses in especially in Korea, Japan and China.
In May, we took a look at the rivalry between growth curves for Kakao and LINE.
7. 37% of top app publishers have already floated
With the likes of Rovio, Kabam and King all rumoured to be looking to selling themselves to public investors in 2014, research from App Annie revealed that 37 percent of the top 100 publishers on the App Store and Google Play have already floated.
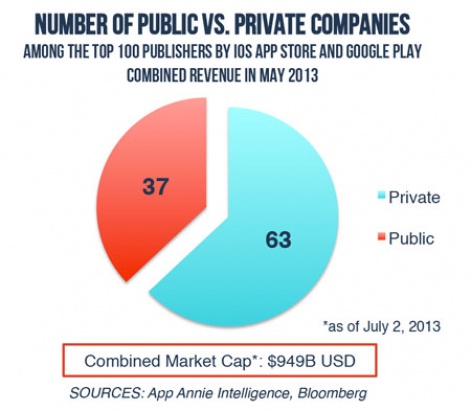
And the number would be significantly higher if Chinese revenue and publishers were taken into account.
6. DeNA has halved the cost of a new Mobage user
User acquisition was a key concern for game developers during 2013, with many complaining about the cost of building an audience using the standard thirdparty options.
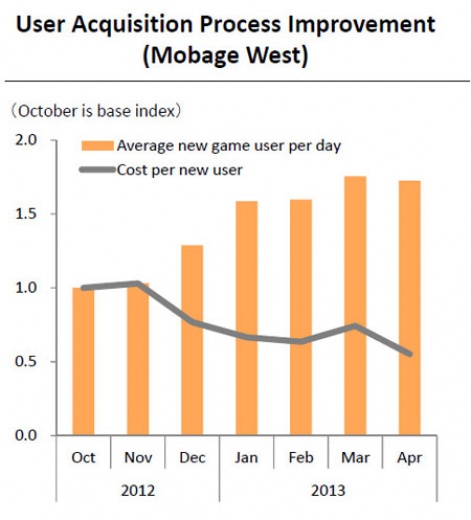
Japanese social platform vendor DeNA hasn't had the best of years, but it has demonstrated that the cost of operating its Mobage platform has enabled it to keep players within its portfolio of hardcore games.
One result has been it claims the cost of each new user in the west (not Japan) dropped by 50 percent between October 2012 and April 2013.
5. Facebook's mobile ad muscle pushes up UA costs to a 2-year high
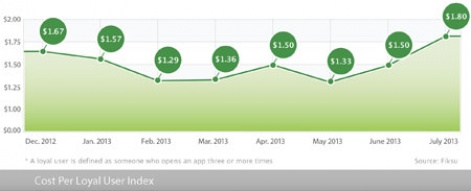
Continuing the UA discussion, one of the big disruptions in 2013 was the rise of Facebook as a mobile game distribution channel.
This was something picked by Fiksu's monthly indices, with its Cost of a Loyal iPhone User rising 20 percent in July 2013 to $1.80, its highest level since December 2011.
4. Google Play now leading on downloads, App Store still winning on revenue
No surprise given the respective install bases numbers, but 2013 was the year when Google Play became the top app store in terms of downloads.
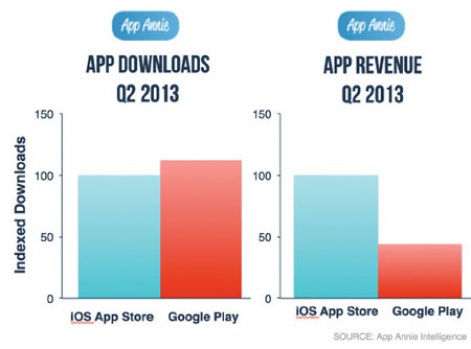
The trend includes some very lucrative markets - notably South Korea and Japan - which are majority Android markets. But more generally the App Store generated over twice as much revenue.
The gap continues to close, however, with the sheer number of Android devices suggesting it could reach revenue parity by the end of 2014.
3. Why getting players to opt-in to game push notifications matters
It shouldn't be surprising that players who get push notifications are more engaged that those that don't.
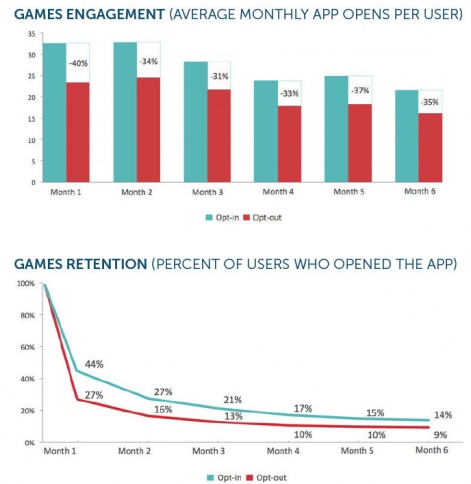
The impact, as highlighted in a survey from mobile infrastructure outfit Urban Airship, might raise an eyebrow though.
It reckons engagement for players who don't get push notifications is between 31 to 40 percent reduced, compared to those who do opt-in. And the impact is particularly strong during the first couple of months.
2. Value of Korean app market up 759% in 2013
Much of the industry's attention was focused on the fast-growing Asian game markets in 2013. But just how fast were they growing?
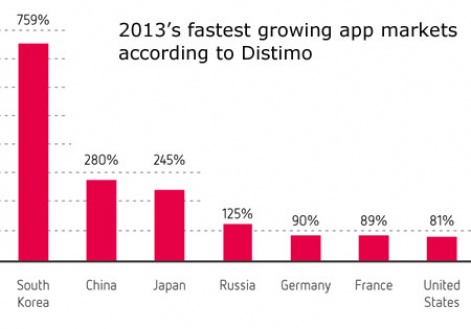
Distimo took a stab at answering that question, recording growth between January and November of 245 percent in Japan and 280 percent in China.
But it was the Kakao- and Google Play-powered South Korean market that was the most impressive with growth of 759 percent.
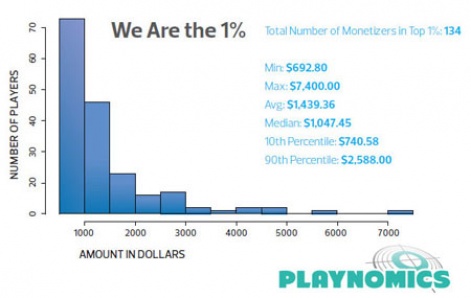
1. How 0.0077% of players generate 33% of F2P game revenue
One of the scariest graphs of 2013 was this one from Playnomics.
Generated by one of its regular player surveys, it revealed that of 1.7 million players (of non-arcade games) tracked during Q1 2013, Playnomics reckoned that only 13,454 spent any money in-game - that's 0.77 percent.
And of these 134 players - roughly 1 percent of the total payer base - their minimum spend was $693, up to a maximum of $7,400.
Or put another way, this 1 percent of payers paid an average of $1,439 compared to an average of $44 across all payers (which includes the 1 percent).