Comment & Opinion

Catch performance issues early with profiling and optimization insights for your entire team in Arm Mobile Studio Performance Advisor

A detailed look at how Arm Mobile Studio Performance Advisor can help you improve your game

Catch performance issues early with profiling and optimization insights for your entire team in Arm Mobile Studio Performance Advisor

Good frame rates and battery efficiency are absolutely critical for top-rated games. High performance helps make sure your game is fun to play and looks great. The mobile game studio Space Ape even found a direct correlation between frame rate and 30-day player retention during internal evaluations of one of their games.

So why is game performance often a tedious and time-consuming afterthought in the development process?

Imagine for a moment that your whole team could get easy-to-understand performance analysis reports with actionable advice regularly throughout the development cycle. Your team could then proactively detect bottlenecks and performance regression early on, and optimize them easily and long before shipping your game.

What if there was a tool to do this analysis for you and generate those reports for your team?

Welcome to the newest addition to the Arm Mobile Studio suite: Performance Advisor.

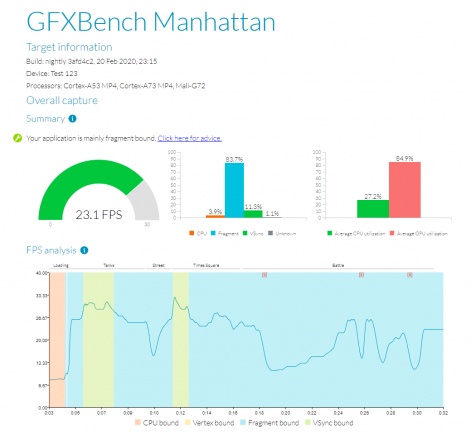
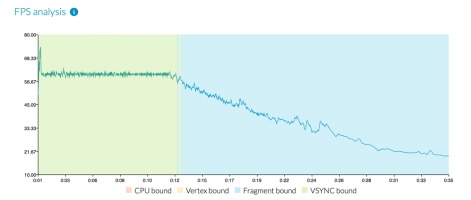
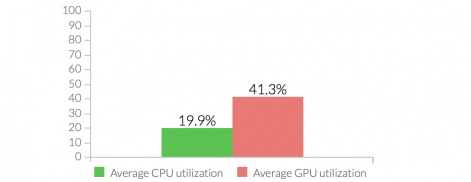
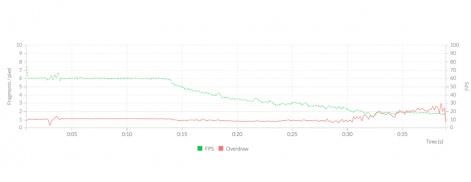
Performance Advisor takes a profile capture of an app running on an Android device and turns it into an easy to digest report of performance data, key metrics and issues, and advice on how to resolve them.

In this article, I’m going to show you what kind of performance profiling and reports are provided by Performance Advisor and explain how this data is useful to your entire development team. With this, you can integrate it with your team’s nightly build and then start each morning with some coffee and your game’s latest optimization status.

In fact, this is exactly what the Space Ape team did as part of their upgraded workflow with automated tests. Read about how they did it on their blog.

Arm Mobile Studio

Arm Mobile Studio, designed to help you build the best games, is a free-to-use suite of tools provided by Arm to profile, optimize, and fine-tune Android games and apps.

It allows you to trace and analyze graphics and shader performance for standalone applications as well as apps built with Unity and Unreal game engines.

The four components that make up Arm Mobile Studio are:

  • Streamline - Capture a performance profile of your game, and explore CPU and GPU activity in detail.
  • Graphics Analyzer - Trace graphics events frame by frame for both OpenGL ES and Vulkan APIs.
  • Mali Offline Compiler - Analyze shader programs and expected GPU performance.
  • Performance Advisor - Generate an easy-to-read summary from Streamline captures with detailed advice on how to improve performance.

One of the advantages of Streamline is the ability to perform deep-dive analysis of your application. The report provides a high-level overview of performance benchmarks, and experts can use this tool to see more detail once they’ve spotted a problem in the Performance Advisor report.


Click here to view the list »
  • Performance Advisor

    Performance Advisor was released with Arm Mobile Studio version 2020.0 and is designed to extract and provide useful data and reports from a performance capture of a game running on devices with Mali GPUs.

    Performance Advisor takes what is traditionally a series of time-consuming steps for manually profiling apps and identifying issues (often done reactively to in-the-field performance issues or complaints) and automates them to generate an HTML report. The summary report means teams can much more easily integrate optimization as part of their development processes and make game performance a priority at low developmental cost.

    The Performance Advisor report builds on the Arm Streamline profiling functionality, using the same hardware performance counters and events to provide insight and answers into key performance questions such as:

    • Is the game CPU or GPU bound?
    • Where does it slow down?
    • What is causing the bottleneck?
    • How can it be fixed?

    The report created by Performance Advisor includes an overall capture summary with frame rate and performance analysis followed by region-specific summary analyses.

    At a high level overview, it shows where your game is achieving your target frame rate and where it is not, because of high CPU load or high GPU load (high vertex or fragment processing demands). You can even configure it to screen capture whenever the frame rate drops below a threshold so that a visual cue of the issue is included as part of the report.

    Here's an example of Performance Advisor report:

  • Key Metrics and Optimization Advice

    There are a number of key metrics provided by Performance Advisor. These are the metrics it uses to point you to relevant advice for optimization.

    Let’s go through them one by one and explore why they matter.

    Average Frame Rate

    When it comes to graphics performance for any game, a high and steady frame rate is the overall goal, so monitoring the average FPS over time helps you identify performance issues, and see when they occur.

    In this chart, you can see that the frames held at a consistent 60 FPS until around the 12-second mark of the capture. At that point, performance began to significantly degrade, bottlenecked by GPU fragment shading, which indicates that there might be too many fragments or too many shader cycles per fragment, or fragments are not being processed efficiently, and that this is a good place to begin optimizing.

    CPU and GPU Utilization

    With mobile games, battery life is also an important factor to make sure that your players can keep playing your game without recharging their phone every ten minutes. Making sure these values are low while maintaining optimal frame rate is the balance your team as mobile game developers have to navigate.

    We can see in this bar graph that CPU utilization is fairly efficient at below 20%, but that the game is on the heavier side for GPU usage and may need some power usage improvements such as reducing the precision of computation in shaders. Mediump uses half the energy per operation of a highp operation.

    Overdraw Per Pixel

    While it’s not completely avoidable, this metric helps identify issues where pixels are overwritten in each frame by transparent polygons or inefficient rendering order, essentially wasting precious GPU operations.

    Even though the frame rate shows a drop starting around 0:14 in this graph, we can conclude that overdraw is not a source of the performance issues because the overdraw value remains near 1 for almost the entire time.

    Draw Calls Per Frame

    At a higher level, you can check the number of API draw calls per frame, indicating where you could batch objects and polygons together to reduce CPU workload.

    The example graph shows a gradual increase in the number of draw calls, which would appear to be contributing greatly to the performance degradation because of its inverse relationship to the frame rate, but the report has not indicated a high CPU load in this case. If we didn’t know that this profile capture was of a benchmark test, this would be pretty concerning.

    Primitives Per Frame

    Vertices are relatively expensive to process. Measuring the number of visible primitives against the total number being processed helps you identify where you could employ better culling techniques or reduce mesh complexity to improve performance. If drops in frame rate correlate with high numbers of polygons in the scene, check whether your content can be optimized to reduce the number of primitives required.

    For this chart, however, the FPS started to drop long before the number of primitives climbed, so optimizing for lower numbers will not likely resolve the performance issues shown.

    Pixels Per Frame

    Checking the total number of pixels being rendered during each frame can show any performance issues resulting from multiple render passes, which might not be as clear simply by looking at other metrics. Issues in post-processing effects in particular could be gauged with this chart.

    Here, the number of pixels drawn per frame stays mostly flat around 2600 regardless of FPS until a big jump after 0:32. Because there is little correlation between these two values, we do not need to worry about optimizing this.

    Shader Cycles Per Frame

    This chart can help you identify whether your GPU is running your shaders properly and efficiently to ensure high frame rate and lower battery power usage. While there might be opportunity to improve shader efficiency by reducing arithmetic complexity, the cycles in this graph look flat for almost 10-seconds past the FPS decline, which would lead us to believe that we can mostly ignore this for now until the frame rate issues are addressed.

    GPU Bandwidth

    Finally, the last metric is GPU bandwidth which displays how you are distributing the GPU workload to make sure you can minimize reading and writing to memory and save energy. Because these values start to increase in the second half of the profile capture, if we wanted to improve bandwidth (and in turn, improve the energy efficiency of the game) this graph helps us limit our performance investigation to what is happening in the game in the latter part of the test.

  • Using Performance Advisor

    Now that you’ve learned about how the new Performance Advisor brings actionable, easy to understand optimization insights for your team, let’s wrap up with how you can take advantage of this and other tools in Arm Mobile Studio and reach maximum performance in your games.

    Using Performance Advisor is quite straightforward and it lets you drop the analyzer right into the project. For example, Space Ape Games created a native Unity plugin, Streamline Native Profiler, to add profiler tags to the report.

    So if you don’t have it already, download Arm Mobile Studio here and get started by watching this Arm video guide, Android profiling with Performance Advisor.

    For an overview of all the tools in Arm Mobile Studio, plus how you can use it in a continuous integration workflow, see the video How to Optimize Game Performance for Android on Arm.

    And for a more technical deep dive into Performance Advisor, I recommend checking out this blog post, Automated Performance Advice for Android Games.

    Lastly, for a full list of optimization topics and advice for common graphics problems, you can refer to this documentation.

    Good luck and may your graphics be steadfast and efficient!


PocketGamer.biz regularly posts content from a variety of guest writers across the games industry. These encompass a wide range of topics and people from different backgrounds and diversities, sharing their opinion on the hottest trending topics, undiscovered gems and what the future of the business holds.