Boston-based app marketing outfit Fiksu has released a pair of new indexes aimed at helping app marketers get a handle on rising CPI costs across iOS and Android.
Drawing on data from 2013, the indexes show a surprising uptick in Android CPI in Q3 with an overall spike of $1.80 - iOS CPI, meanwhile, remained stable at about a dollar.
Breaking down the CPI between non-game apps and games, however, yielded an interesting result - the primary driving force behind the Android CPI spike in December was non-game apps.
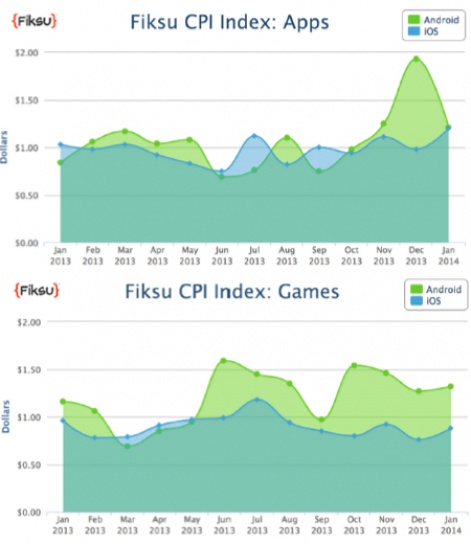
Fiksu points to incentivized networks on iOS as the reason why a similar spike wasnt observed on the App Store. These networks provide a low-cost, high-value marketing tool to boost visibility and drive installs during a busy holiday season.
On Android, install volumes have a less immediate impact on app visibility.
At what cost users?
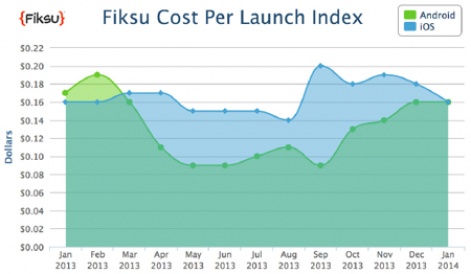
The second index launched by Fiksu is the Cost per App Launch Index, which tracks the cost of each repeat app launch over time with a focus on engagement and ongoing value.
Intriguingly, the Cost per App Launch Index was just $0.16 across both iOS and Android - marking the first convergence of app engagement costs on both platforms since February 2013.
Fiksu explained the rare convergence in January as a post-holiday correction following large-budget campaigns launched around Christmas.