
The mobile game ecosystem is now mutually embracing. When it comes to platforms, more is more.
Still, while Android powers ahead in terms of its install base, when it comes to cash, iOS still rules, both in terms of per user metrics and absolute revenue.
Hare and tortoise
Store intelligence outfit App Annie makes that point clearly in its Q1 2013 trends report.
While the number of downloads from Google Play are now around 90 percent of App Store downloads, Apple's store generates 2.6 times the revenue.
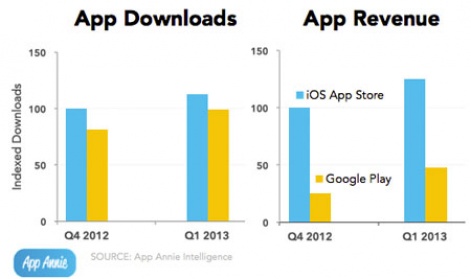
Yet Google Play is growing fast. App Store quarterly revenue was estimated to have risen by around 25 percent quarter-on-quarter, while Google Play was up 90 percent.
Off platform payments
Mobile billing specialist Fortumo has also been delving deep into the Android ecosystem.
Significantly, it enables developers to hook up to carrier billing in 73 countries, so gets around the issues of Google Checkout and low credit card penetration in certain geographical locations, also for young people.
(Obviously, this means revenue from such companies, including the likes of Amazon, aren't being included in App Annie's estimates, suggesting it's underestimating the overall worth of the entire Android ecosystem.)
Aggregated from 1 million IAP transactions from Android devices through its platform in January 2013, Fortumo sees the vast majority of sales activity occuring on smartphones - 96 percent compared to only 4 percent on Android tablets.
It breaks down Android fragmentation, which remains an issue.
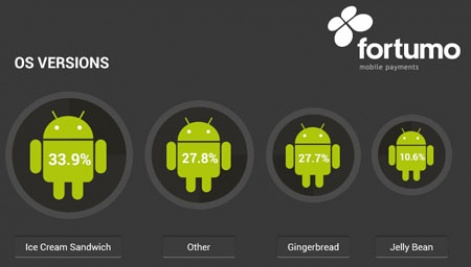
Android 4.0 (Ice Cream Sandwich) boasts the biggest fragment, with Android 4.1/4.2 (Jelly Bean) on 10.6 percent.
Legacy OS Android 2.3 (Gingerbread) remains important with over a quarter of the tracked market, while 'Other' - presumably the likes of Froyo, Honeycomb and forked platforms such as Nook and exotic Asian OEMs - is the second largest.
And when, considering the payment behaviour in different countries. Fortumo also comes to some interesting conclusions.
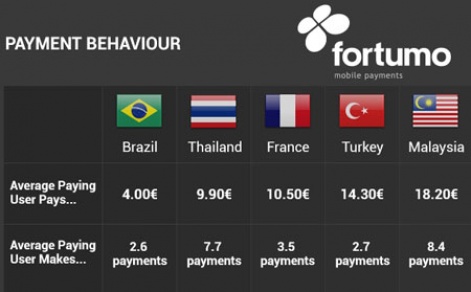
Malaysian Android owners spend the most, more than four times Brazilians, although in terms of the number of payments, it's just over three times.
And Turkish owners, by far, spend the most per transaction.


