Creating an app or mobile game is one thing, but staying on top of its performance is something else entirely. Developers are able to create a clearer picture of their titles by analysing key metrics and making changes that improve the experience.
With players demanding better quality games and an abundance of titles to choose from, competition is fierce. Therefore, knowing what to keep a close eye on and how best to do so is increasingly important.
In a recent joint meetup between Azur Games and Google Ads, the development and monetising of hypercasual games was analysed. As part of this meetup, Azur Games CRO Maxim Kozhnov shared some insight regarding metrics and how to improve your analytics.
______________________________________________________________________________
Currently, there's a lot of talk about how games are becoming more complex and how player demands for quality and quantity of content are increasing. As a result, the analytical approach is also improving. I want to explain how you can improve your analytics and move beyond simple metrics to more complex ones that will benefit your project.
Let's start by briefly discussing general metrics that everyone knows and uses. These can be divided into three groups.
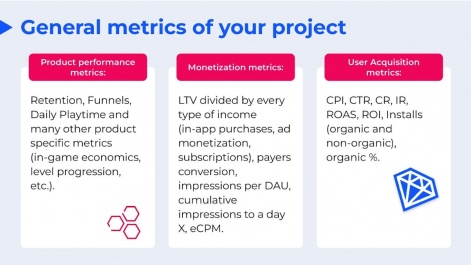
Firstly, there are product metrics such as retention, playtime, and other. There's nothing new to say about these.
The second group is monetisation metrics. These include in-app purchases, ad monetisation, and subscriptions. The main metric here is LTV. Other metrics we look at include impressions, daily impressions, cumulative impressions up to a certain day, and so on.
The third group is user acquisition metrics, including CPI, CTR, conversion rate, install rate, ROI, and organic percentage. These metrics are also fairly standard.
However, it's important to remember that your main metric is always return on investment (ROI). If it's higher than 100%, your project is profitable. There are various ways to achieve this.
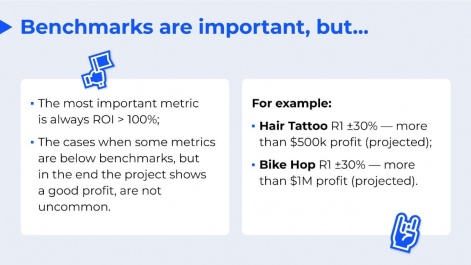
For instance, you may have a relatively low retention rate, but your organic percentage could still be very high, which is excellent for your product. Alternatively, you may have a high CPI, but your LTV is even higher, which could also result in a good ROI. Therefore, it's not uncommon for certain metrics to fall below benchmark values, yet your product can still generate a substantial profit. For example, our Hair Tattoo and Bike Hope projects have R1 rates of around 30%, but they can still achieve excellent profits by the end of their life cycle.
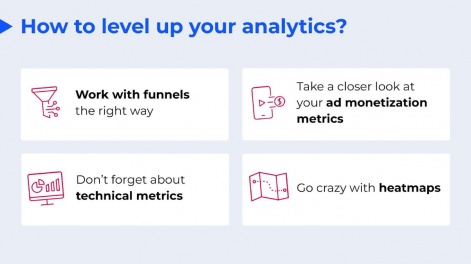
Now let's move on to more complex topics. I'll divide them into four themes: funnels, ad monetisation metrics, technical metrics, and the most interesting part — how to work with heatmaps.
Working with funnels
Let's start with funnels. They're a widely-used tool in analytics that help track user churn rates at different stages.
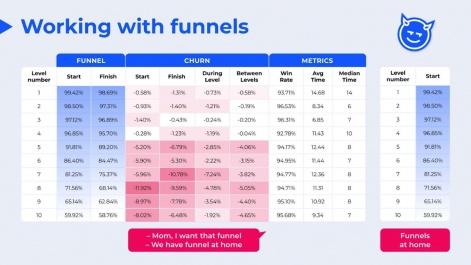
On the right side, you can see an example of a simple level progression funnel in one of our games, but it doesn't provide much information to draw conclusions from.
To gain more insights, we add more metrics to our funnel, as shown in the table on the left. First and foremost, we divide our funnel into the start and the end of the levels. This allows us to understand at which stage people are actually leaving the game — during a level or between them — for completely different reasons.
Additionally, we add the win rate and average time spent on a level to our funnel, so we can precisely determine why a user left, whether it was due to a difficult level or a level that took too long to complete.
Let's take a closer look at why it's important to consider step length when working with churn rate. Here's an example funnel for a city-building game, or an idle game.
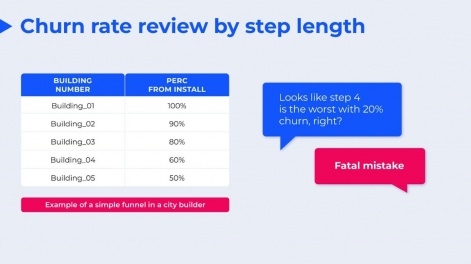
At first glance, step four may seem to be the worst with a 20% churn rate, but it's actually more complex than that. If we add the time elapsed since installation to this funnel, things become clearer.
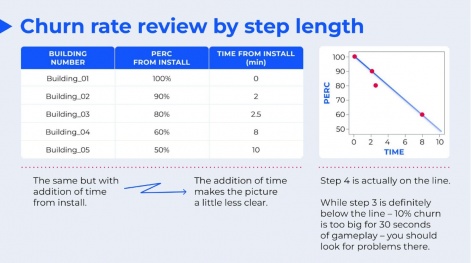
At step four, the churn rate is 20%, while it's only 10% for other steps. However, step four takes longer to complete, so it's reasonable to expect more people to leave the game over a longer period of time.
To clarify the situation, let's plot all the data points on a graph where the y-axis represents the percentage of players from the time of installation, and the x-axis represents the time elapsed since installation. Now, we can see that step four actually falls on the same line as all the other steps except step three. This is because a 10% churn rate is significant for only 30 seconds of gameplay. So, you should be looking for issues there instead of focusing on step four.
Let's talk about advertising networks
We have multiple advertising networks in our games, but in some cases, advertising from certain networks may elicit a negative response from users. For instance, they might have issues with software development kits (SDK) or problems with closing the ad window, or the advertisements might simply be too aggressive. To monitor this issue, we look at the session closure rate. An example of this metric can be seen in the following table.
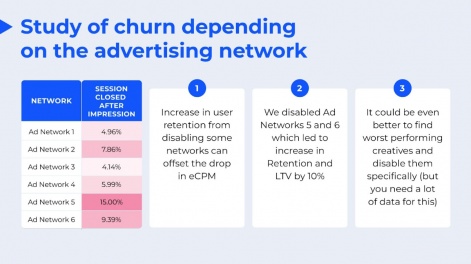
This is real data from one of our games. To calculate this metric, we divide the number of impressions that led to session closure by the total number of impressions in the network. As you can see, it's evident that some networks perform worse than others.
Therefore, we completely disabled Ad Network 5 and 6. This led to a 10% increase in retention and LTV. Usually, it's not a good idea to turn off entire advertising networks because your eCPM may drop. However, in some cases, increasing retention by disabling some networks can compensate for the eCPM drop, resulting in profit. It's even better to disable specific ads causing issues, but you need a lot of data for this. In our case, since it was a relatively small project, we didn't have enough data, so we completely disabled two advertising networks, yet we still got good profit.
When analysing ads, it's important to also examine the distribution of impressions among users.
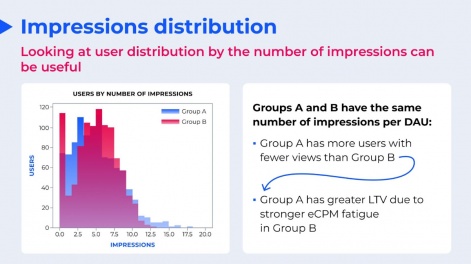
This is because there are instances when you have an equal number of impressions per user, but the LTV differs between groups. This happens due to eCPM fatigue with every subsequent view for each user. For example, in group B on this graph, many users didn't watch any ads, while many others watched a lot of ads. In this case, the LTV in group B will be lower than in group A.
Moving on to technical metrics
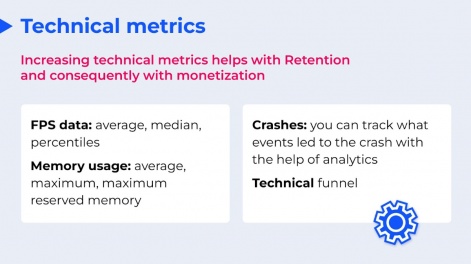
It is evident that your project's technical condition significantly affects retention and, consequently, monetisation. Despite this fact, few people pay attention to it.
What do we mean by technical metrics? Firstly, we refer to FPS, average and median values, to understand how smoothly the game runs. We also track the number of FPS drops, periods when the FPS drops below certain levels. Memory usage is also tracked in a similar manner. Additionally, sending data about crashes to analytics is helpful to know which specific events in the game caused the crashes. It is recommended to send this data to specific crash tools like Google's Crashlytics.
Finally, we utilise technical funnels to identify problems in loading sequences.
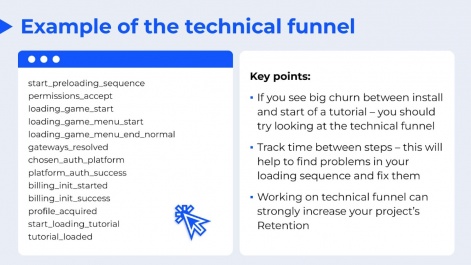
The steps in this funnel represent important stages during the loading process, such as accepting permissions, loading game resources, loading SDKs, acquiring a profile from the server, and similar activities. This can help you locate problems effectively.
If you observe a high churn rate between the installation and start of the tutorial, you should investigate the technical funnel. Furthermore, it is advisable to track the time between steps in this funnel, as some steps may take longer than expected.
Here is an example of how technical metrics are used in a real-life situation in a multiplayer shooter game, World War Heroes.
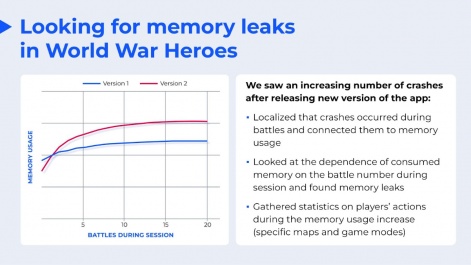
Following the release of a new version of our game, we noticed an increase in the number of crashes. Our developers determined that most of these crashes were related to memory usage, and our analysts discovered that they mainly occurred during battles. To address the issue, we examined the relationship between memory usage and battle numbers and found memory leaks. We collected additional analytics on this problem, identifying the maps and game modes where it occurred, which helped us to find and fix the issue.
Heatmaps
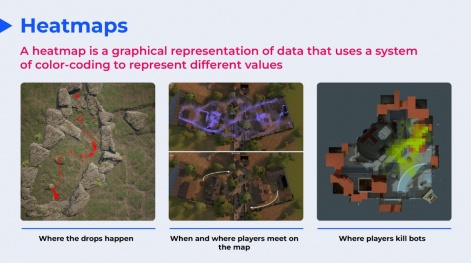
A heatmap is a graphical representation of data that uses colour coding to represent different values. Here's a few examples:
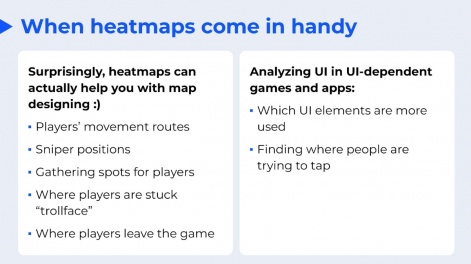
They can be very helpful in level design, allowing you to study player movement routes, sniper positions, gathering spots for players, areas where players get stuck, or where they exit the game. Heatmaps can also be used to study user interface (UI) elements in UI-dependent games and apps, such as identifying which elements are more frequently used and where users tap on the screen.
While we primarily use heatmaps on our midcore projects, they can be useful in hypercasual games as well, especially if the game has complex maps.
Here’s how we used heatmaps for an off-road simulator:
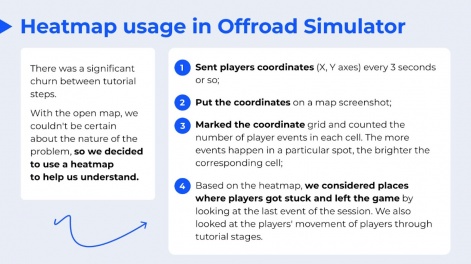
This game requires you to manoeuvre a truck through challenging terrain by utilising gear shifting and other intriguing truck driving tactics. We noticed a significant drop-off in players between tutorial stages, but couldn't discern why due to the map being too open-ended, resulting in several hypotheses.
To address this issue, we began sending player coordinates to analytics every few seconds. These coordinates were then placed onto a map screenshot, where a coordinate grid was marked, and the number of player events in each cell was tallied. The brighter the cell, the more events took place in that particular spot. Here's an example:
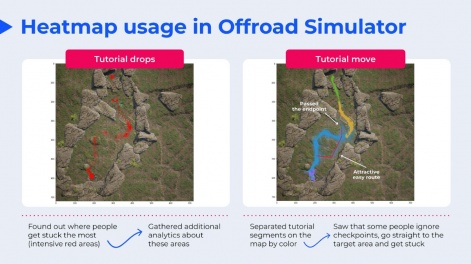
The intense red areas on the left map indicate where players got stuck the most. By identifying these spots, we were able to modify the map and incorporate additional tutorial tips to assist players in comprehending what they needed to do.
We also colour-coded the tutorial into complex segments and discovered that some players simply disregarded tutorial tips and proceeded straight to the target goal, which led to being stuck. Here's a screenshot from the game:

The blue line represents the tutorial path from one checkpoint to another, while the red arrow indicates the final objective. Some players saw the objective right away and attempted to reach it directly, resulting in being stuck on rocks. Thanks to the heat map, we were able to identify and address these issues, resulting in a 15% increase in retention and tutorial progression.
Edited by Paige Cook