YouTube gaming creators "command 23% higher deal rates than Twitch"

- YouTube gaming creators command 23% higher deal rates than Twitch streamers, according to Collabstr data.
- Short-form content is becoming a bigger part of gaming creator campaigns with brands increasingly requesting video, reels, stories, ads and shorts.
Kyle Dulay is the co-founder of Collabstr.
If you ask most gaming marketers where the creators are, the answer will probably be Twitch. It is the reflex response, and on live viewership, it's defensible. But viewership is not a rate card, and an allocation built on watch hours is an allocation built on the wrong measure.
So we’ve gathered a sample of completed, paid transactions on our own platform to see what gaming creators are actually being booked at. Defaulting to Twitch out of habit comes with trade-offs: for brands, it means sacrificing stable rates; for creators, it means leaving earnings on the table.
YouTube Gaming creators command 23% higher deal rates than twitch streamers
Within this dataset, YouTube connections outnumber Twitch by approximately 15.5 to 1 across all niches. That figure describes total supply rather than gaming supply, and therefore, we narrowed the analysis to the gaming category and to transactions that were completed and paid.
Across the gaming quarters our rate index reports, each cell carrying at least three completed orders, spanning 2023 to July 2026, YouTube gaming creators transacted at an average of $203.35 per deal. Twitch gaming creators averaged $165.70. That is roughly 23% more per deal on YouTube, within the same niche, on the same platform, drawn from the same population of brand buyers.
Within this dataset, YouTube connections outnumber Twitch by approximately 15.5 to 1 across all niches.
In addition, YouTube pays creators 70% of net revenue on memberships, Super Chat, Super Stickers and Super Thanks, and 55% on watch-page ads. Twitch's May 2026 "Monetisation for All" announcement widened access to subs and Bits for every streamer and halved the Affiliate requirements. It broadened who can monetise without changing what they keep.
Multi-platform is now the rational default rather than a hedge: when Kai Cenat ended his Twitch exclusivity in July 2026, he came back broadcasting to Twitch and YouTube simultaneously, peaking at 711,000 concurrent viewers on Twitch and 404,000 on YouTube at once.
High cost of unpredictable rates
In enterprise media planning, nearly every channel comes with historical pricing trends. Creator marketing, however, remains one of the few channels where buyers are often expected to accept a single quote and build an annual budget around it. For media planners evaluating how stable rates are over time, YouTube and Twitch behave in different ways.
YouTube gaming demonstrates consistent benchmark pricing across multiple quarters, supported by a creator supply that outpaces Twitch by 15.5 to 1. In contrast, Twitch's smaller creator supply leads to greater price variations between quarters, posing a challenge for media buyers looking for predictable campaign costs.

Stable prices matter as much as the average deal size. The transacted price per collaboration on Twitch gaming shows substantial quarter-to-quarter fluctuation: starting at an average of $87.50 per deal in 2023-Q4, rates surged 179% to peak at $244.23 in 2025-Q4, before stabilising at $215.50 in 2026-Q1. Meanwhile, YouTube gaming maintains a higher deal ceiling, reaching an average of $304.17 per collaboration in 2024-Q4.
These are transacted deal prices, and creators keep less once fees come out. Our 2026 Influencer Marketing Report tracks list prices against realised creator payouts across the broader marketplace. Twitch creators list the highest average asking price of any platform at $398 and realise $127, a capture rate of 32%. YouTube creators ask $311 and realise $255, or 82%. Twitch creators are pricing like premium inventory and getting paid like the opposite.
For a planner, the conclusion is not that one platform is good and the other is not, but that one offers a rate history to forecast against, and the other offers five observations and a 56.5% decline between two of them.
Brand demand is already moving
Most categories are benchmarked against what they cost. Gaming is more usefully benchmarked against what it returns for that cost, and against whether you can secure it at all.
Based on the dataset, over the last twelve months, brands posted 141 gaming campaigns at an average budget of $3,373.62 per campaign, more than four times the average lifestyle campaign budget. Average order value for gaming stands at $201.33, marginally below our platform-wide figure of $214.42. The spend is going into volume instead of the rate.
Based on the dataset, over the last twelve months, brands posted 141 gaming campaigns at an average budget of $3,373.62 per campaign, more than four times the average lifestyle campaign budget.
Verified engagement rate among the gaming creators in this sample is 6.63%, the third-highest of 26 niches. Brands are therefore purchasing above-average engagement in a category priced slightly below the platform average and the reading is that price has not yet caught up with scarcity. That is an unusual position for a category of this competitiveness.
Third-party data points in the same direction. Stream Hatchet's annual 2025 report found Twitch's market share declined 8.3% across the year, while YouTube Gaming reached a record 8.8 billion watch hours over the full year, an increase of 12%.
Sponsored activity is following: gaming stream sponsorship on YouTube returned to 4.5 million watch hours in Q4 2025, a level last seen in 2020. Twitch is not in collapse, but it is being displaced as the default, which is a slower process and a considerably easier one to overlook.
Do brands pay above-market rates?
Not on the unit price. Gaming transacts slightly below our platform average, but that average hides what actually sets the number, which is the follower tier.
Unlike categories like Beauty or Fashion, where brands frequently pay higher rates for dedicated review videos, gaming sponsorships predominantly centre on quick integrations. 30- to 60-second mid-roll shoutouts, stream overlays, or quick gameplay mentions in integrated formats lower the average entry price per deal while allowing brands to purchase higher overall deal volume.
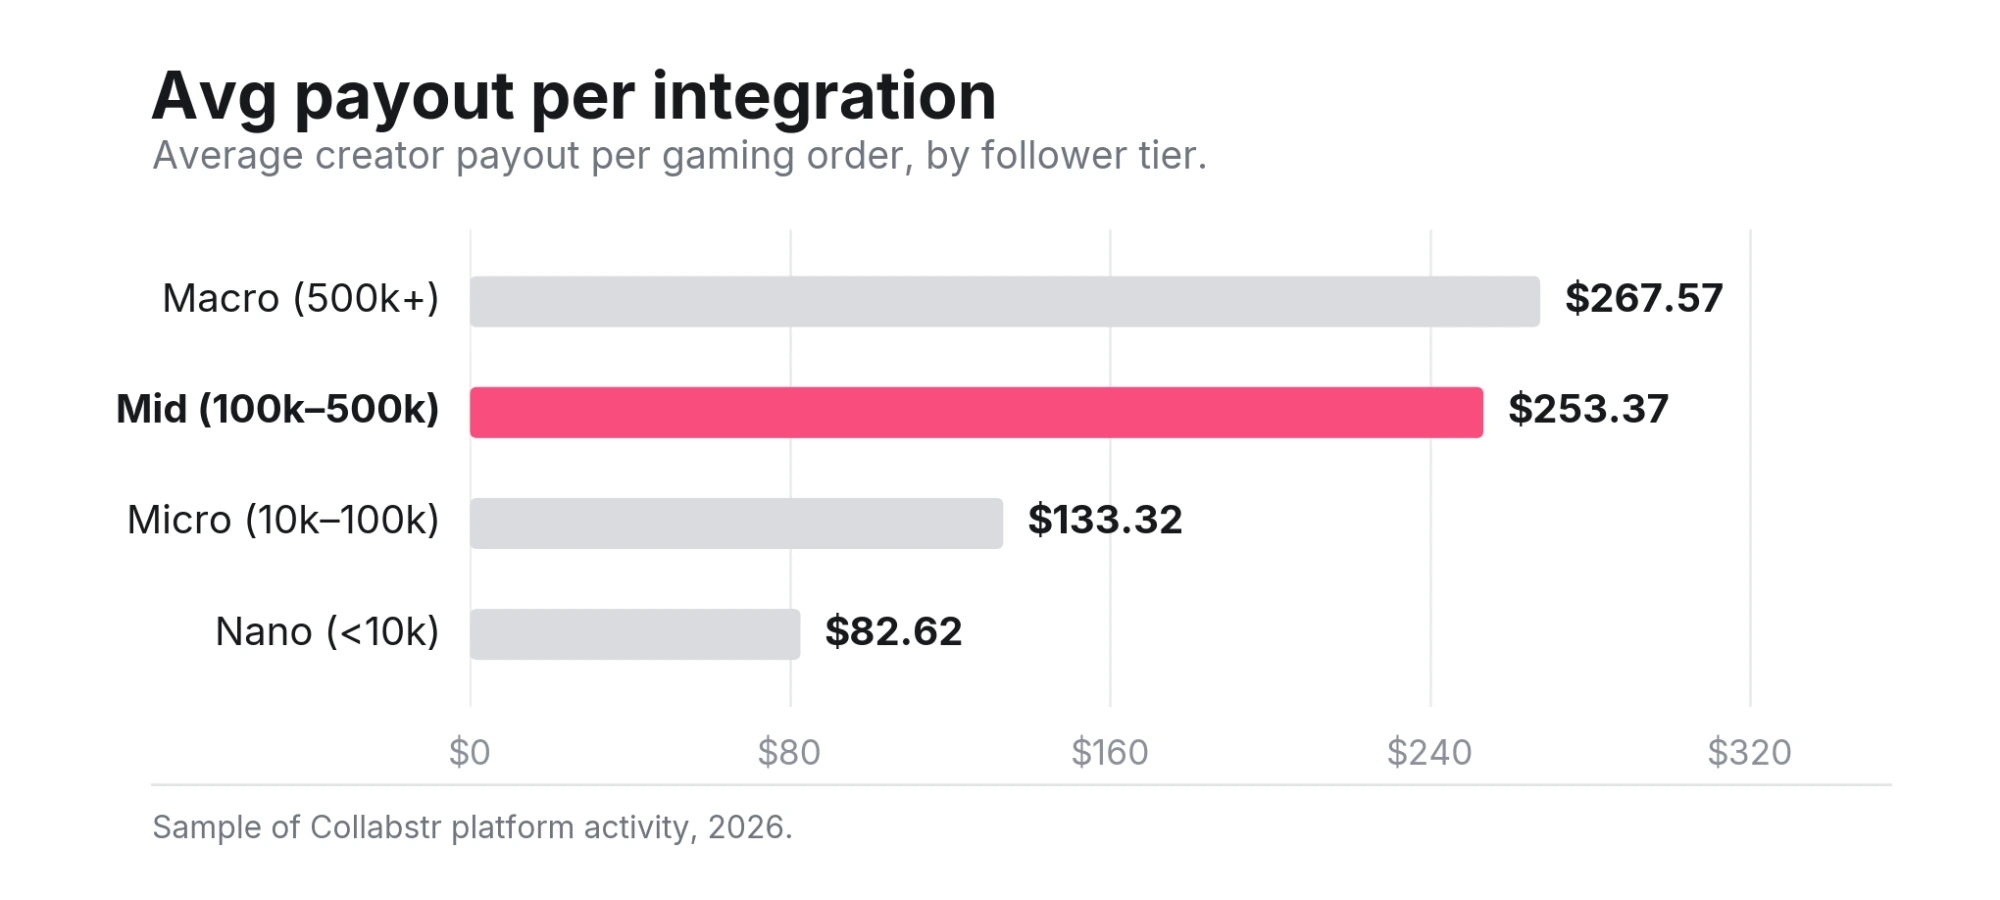
Moving from micro to mid nearly doubles per-deal earnings. Moving from mid to macro adds approximately 6%. The single highest-leverage progression in a gaming creator's career is crossing 100,000 followers, and little that follows compares to it.
That same distribution is what makes gaming rosters difficult to assemble at scale. Across the gaming creators in this sample, roughly 41% are micro and 30% nano, while 28% sit at mid or above.
Roughly seven in ten gaming creators sit below the tier where per-deal earnings nearly double, so a brief written for large creators draws on the smallest part of the distribution. Paying more for the largest gaming creators is a distribution problem. Cost of reach actually inverts that ladder.
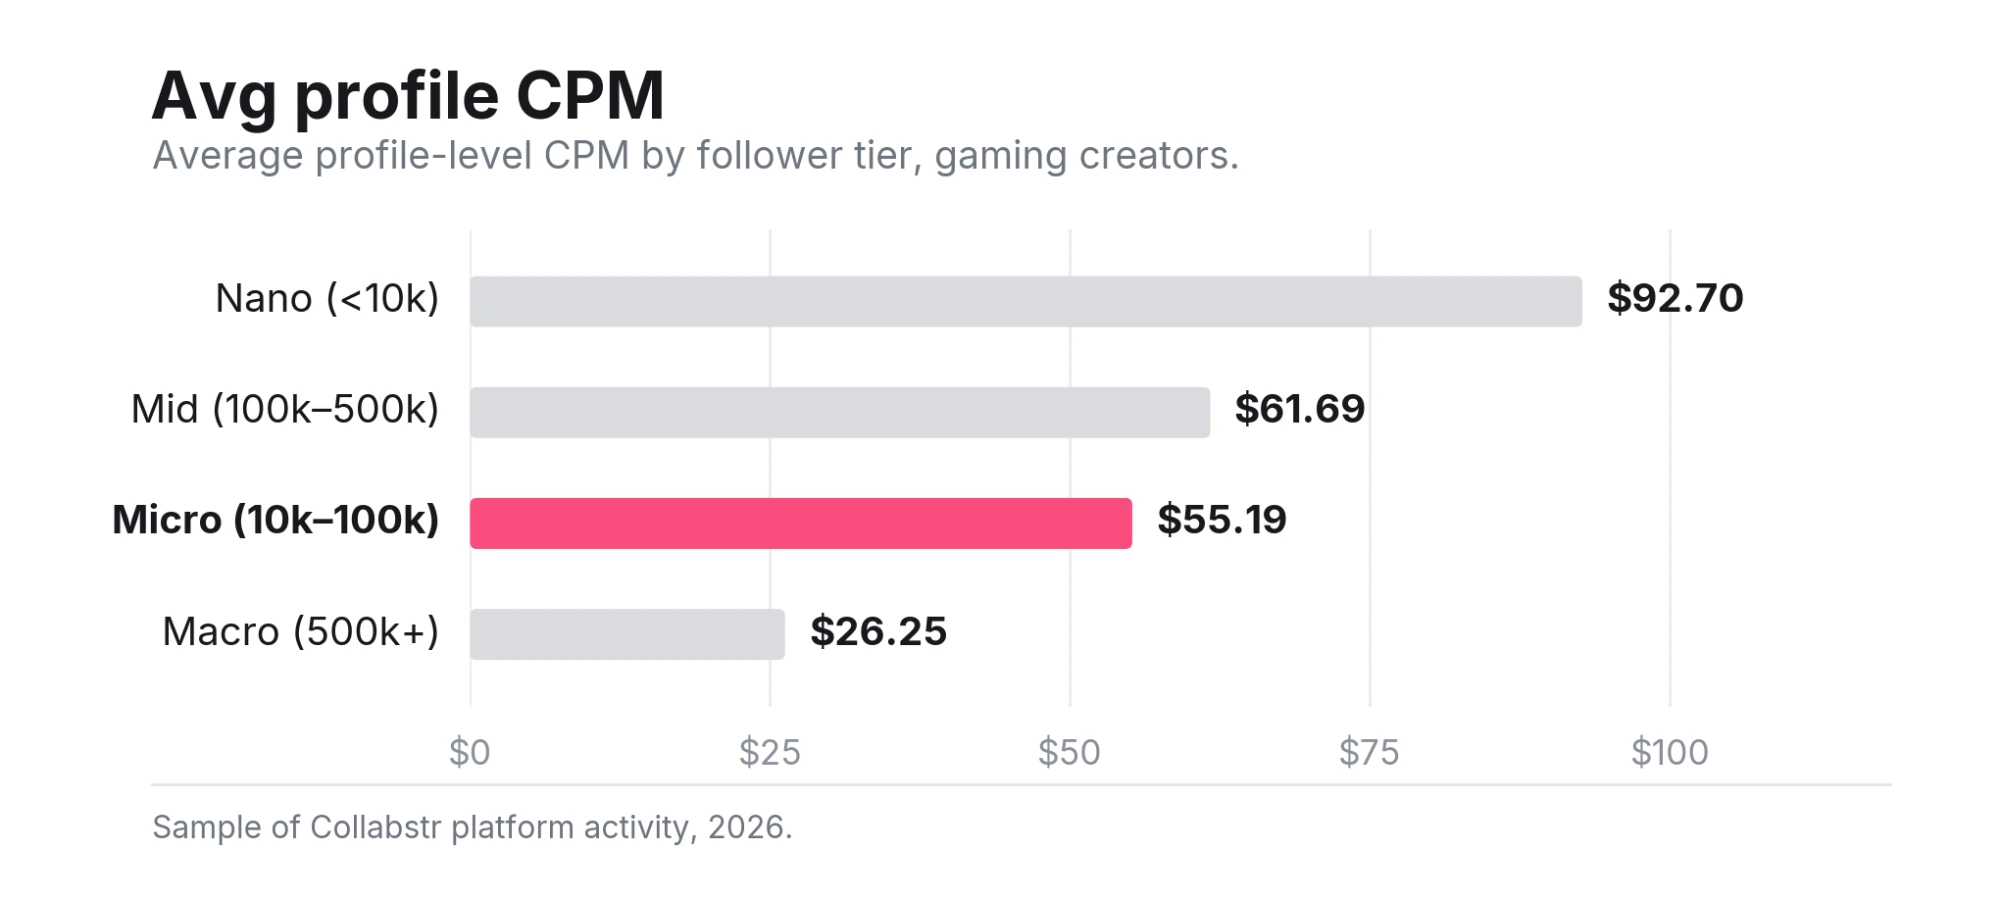
Projected CPM does not fall cleanly with size, since micro sits below mid, but the macro tier is far cheaper per thousand than anything beneath it. A program built for reach concentrates spend in the tier where projected CPM is lowest, which raises the total on the invoice while lowering the cost of the reach inside it.
Set that against the highest refusal rate for gaming of any niche and a senior tier that is a minority of the category, and what brands pay for gaming reflects competition for scarce inventory. Low unit price and efficient spend are not the same measure, and a roster optimised for the first works against the second.
For brands and creators, start stacking formats
Gaming is one of only three niches in this dataset where "Short" appears among the top five requested deliverables. Brands are requesting video, reels, stories, video ads and shorts from gaming creators, in that order.
Each of them is an asset the brand retains, redeploys in paid media, and measures. A live stream is an event, while the remainder is inventory. An allocation still structured as sponsorship of moments rather than acquisition of assets is purchasing the least durable output in the category at the highest variance.
For creators, the same finding applies in reverse. A creator who streams without also publishing long-form and short-form video is forgoing the highest-rate deals available. Gaming content on YouTube Shorts grew 60.6% year over year to 5.3 million posts, and YouTube continues to ship tools that allow creators to re-monetise back catalogues by placing new advertising against older uploads, an asset class live streaming does not produce.
Gaming is one of only three niches in this dataset where "Short" appears among the top five requested deliverables.
IAB and Advertiser Perceptions project US creator-economy ad spend at $43.9 billion in 2026, an increase of 18%. A meaningful share of that will reach gaming on the strength of habit.
Based on our data, an allocation that defaults only to Twitch anchors the budget to a lower average deal capture rate; however, it shows higher rate fluctuation compared to YouTube. But let’s put a strong emphasis here: Twitch should not be abandoned. The argument is about requiring it to earn the line item, as every other channel in the plan is already required to do.
Collabstr figures are drawn from a sample of platform activity current as of July 2026. Transacted prices reflect what the brand paid; payouts reflect what the creator received after fees. Expected views and profile CPMs are platform-computed projections from live creator profiles.
Companies

People