This is a sponsored post from GameAnalytics.
If you haven’t seen the news, then let us be the first to tell you we’ve released our latest — and biggest to date — mobile benchmarks report.
Now covering 1.2 billion monthly active players across nearly 100k games, it highlights the key trends and insights from H1 2019, so that you can see how your title truly compares to the rest of the industry.
Short on time? Not a problem.
In this post, we’ve summarised the key takeaways from this study, and what this means for mobile game developers around the globe.
How to read our graphs
We’re packing a whole lot of data into one report, with analysis that covers both seasonal trends and breakdowns by genre.
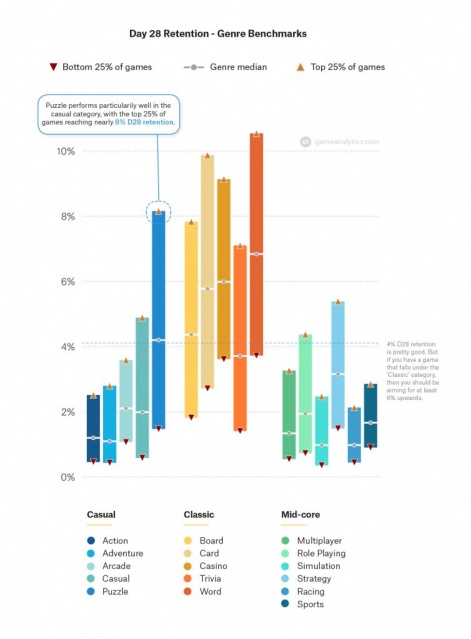
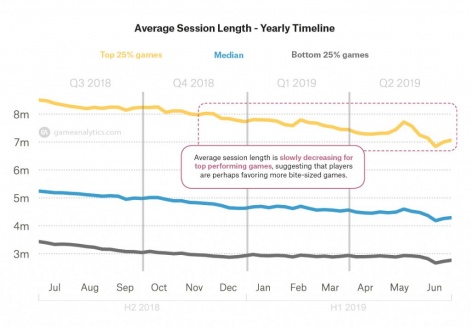
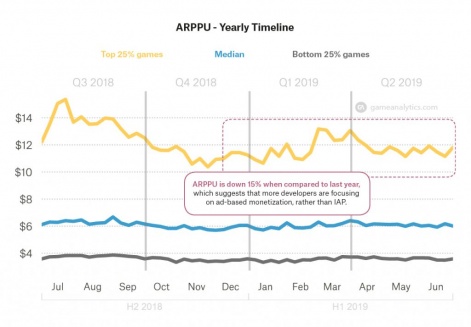
So, to keep things simple, we presented our findings with 2 different plot types: time-series (for trends), and stacked bar charts (for genre benchmarks).
This time, we’ve also changed our quantiles, now showing the top 25%, the median, and the bottom 25% of game performance.
Don’t forget to download yourself a free copy here for later.
And there’s even more…
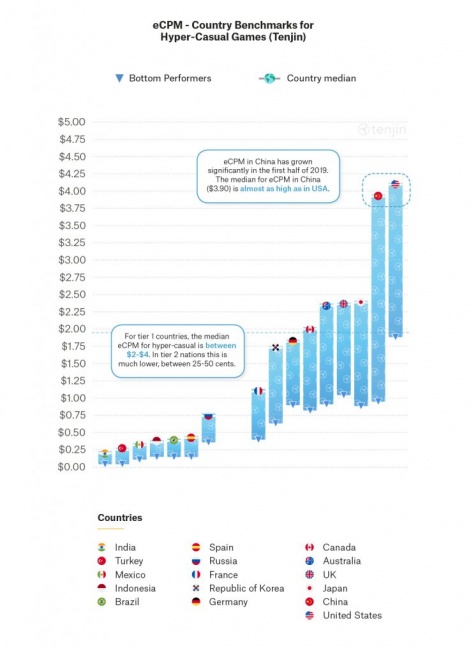
We now have eCPM and CPI insights inside this report, thanks to our good friends over at Tenjin.

This is presented again as a yearly timeline, but also by country breakdown, for both the median and the bottom performing games.
So, now that you’re familiar with our graphs, click through to get our top five takeaways from the report.
Click here to view the list »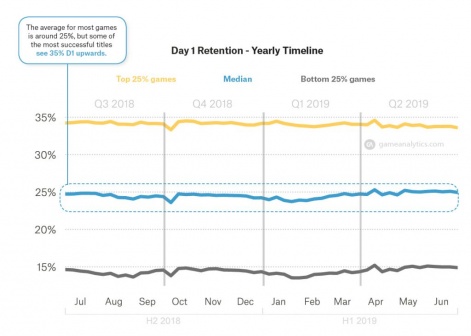
")