Game performance is arguably one of the most important components that contribute to the success of a game. It is particularly critical in mobile games where each player’s device type and capability can vary greatly.
Arm Mobile Studio provides tools that help Android game and app developers benchmark, optimize, and debug CPU, GPU, and even bandwidth use. It can be used for analysing standalone applications or as a complement to building apps with the Unity and Unreal game engines.
Their latest addition to the suite, Arm Performance Advisor, now enables you to run a performance profile and extract clear, easy-to-understand data, key metrics and issues, and optimisation advice. It even transforms a profile into an HTML report that you can share with the entire team.
What makes it even better is that Arm Mobile Studio Professional Edition includes headless continuous integration (CI) support for Performance Advisor, which game studios can use to easily set up automated on-device performance testing across an entire device farm.
In this article, we will examine how the headless Performance Advisor works with CI systems. We will also give an overview of the steps you can take to automatically generate useful analyses and visualisations for your team on a regular basis. We will then see how the generated data can help identify issues as soon as they are introduced during the development process to ensure a high-performance gameplay experience for your players at launch.
Why game performance matters
It’s simple. The best mobile games and apps are fun, look great, have steady frame rates, and are battery efficient to keep users engaged and playing longer.
Without good performance and gameplay experience, your players will stop playing your game. There is a direct correlation between frame rate and player retention, and maintaining steady high performance in mobile games and applications is a tough challenge. This is complicated further for Android app developers because they have to support a wide range of devices with varied capabilities.
CI for performance testing
If you are a mobile game studio that is serious about ensuring a broad audience for your games, you want to target as many devices as possible. This requires lots of testing on different Android devices, which is a daunting task if done manually.
Assigning testers to continually run through performance tests on every device in your device farm is time-consuming and expensive, so you want to avoid doing this kind of testing manually if you can.
Ideally, you want to test your game’s performance on a multitude of devices during the development process so that you can fix problems immediately when they appear rather than trying to track them down and patch them up later on. Just a bit of upfront performance analysis effort, debugging and testing performance throughout the development, can save your team a lot of time in the long run. It could potentially even save your game.
The main tools you need to set this up for your team or organisation are a performance analysis tool that can run in headless mode and a good CI system to control it through remote commands.
Headless Performance Advisor with CI
In a previous article, Catch performance issues early with profiling and optimisation insights for your entire team in Arm Mobile Studio Performance Advisor, we looked at using Mobile Studio with Performance Advisor through its user interface. If you would like to see the interactive Performance Advisor in action, take a look at this great blog post by Arm.
This time, we’ll look at one of the key features in the Arm Mobile Studio Professional Edition: A headless Performance Advisor.
I’ll explain the high-level steps to setting it up in an Android device farm with a CI tool for automated testing.
Configure your device farm for Performance Advisor
First, configure your test devices to capture a performance profile on the host machine:
1. Set up Mobile Studio on each host machine in your device farm.
2. Ensure each device is configured for debugging.
3. Use Streamline to generate a configuration file for each device.
Set Up CI Integration
Once Performance Advisor is set up for all of the devices connected to the host machine, set up a CI tool such as Jenkins, TeamCity, or Buildbot for your network. You can use any CI that can run commands both on your host machines and a CI server to orchestrate the actions.
Configure CI commands
After you’ve finished setting up your CI server, you’re just a couple of steps away from continuous automated testing.
Here are the steps you could follow for daily performance testing:
- Schedule a task to run every evening that pulls the latest code and assets from your project repository.
- Set up a CI command that builds a debuggable version of your application using the Android SDK after every code pull.
- Create another CI command for Android Debug Bridge (adb) that installs the application on each connected device after every build.
- Configure a CI command that instructs Arm Mobile Studio to generate a headless capture using the configuration file previously created on each device connected to the host.
- Generate the report and then export the performance report in both human-readable HTML and machine-readable JSON file formats.
For a more in-depth walkthrough of this process, see the full tutorial on integrating Mobile Studio into a CI workflow.
Review the performance data
This final step depends on what you want to do with your performance data.
Perhaps you could run a CI task to compile the HTML reports from each device into an emailed summary for your team to look through during the next daily stand-up meeting. Quickly see how the average FPS has changed since yesterday, and analyse any CPU or GPU issues Performance Advisor has identified. (The video Performance Reporting with Arm Mobile Studio demonstrates this process.)
In one scenario adopted by many teams already, you push the data from each of the exported JSON files to Elasticsearch, which would allow you to easily visualise it with a tool like Kibana. We will go through some example visualisations in the next section.
While this process may seem like a bit of work, keep in mind that it is a one-time cost that will enable continuous automated testing for your team for countless days. It’s worth it.
The net result is unlimited testing scalability. Any new test devices will only need to be configured once.
Visualising your test data
Now that we’ve taken a high-level look at how you can set up automated performance testing in an Android device farm, let’s check out some of the ways you can work with the data it generates.
Take a look at these basic performance graphs and visualisations generated using Kibana with data pushed into Elasticsearch. They showcase a few examples of the kind of automated performance insights that can be made available to your team.
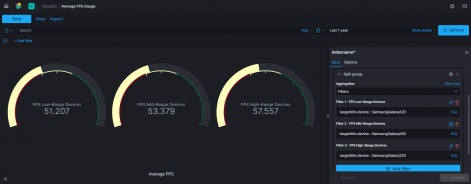
Average frame rate across devices
Frame rate is a fundamental metric for recognising if an app is running smoothly. This gauge visualisation shows all test devices falling short of the targeted 60 fps with the high-end devices very near the target frame rate and low-end devices significantly lower at an average of 51.207 fps, which may indicate a need for performance optimisation.
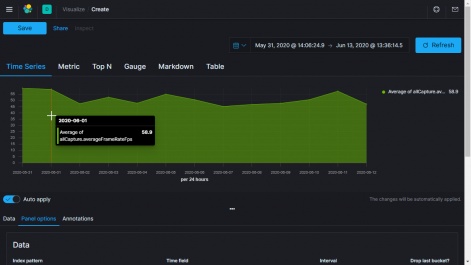
Daily Average Frame Rate
The time-series graph can be used to gain valuable progress insight as well. This line graph helps visualise the average FPS of the performance captures over a period of two weeks. It reveals when the project performance degraded over time and when the team took a day to address the performance issues within the game.
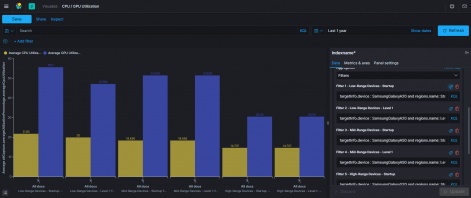
Average CPU and GPU utilisation
Knowing the CPU and GPU utilisation is especially important for mobile applications because it directly affects battery efficiency. Players have to stop playing your game when they need to recharge the device and this may lead to losing interest in the game as well. Here we can see that the CPU utilisation is slightly lower for high-end devices in contrast to the low-end devices while the GPU utilisation is significantly lower, reflecting more room for optimisation on the GPU for low-range and mid-range devices.
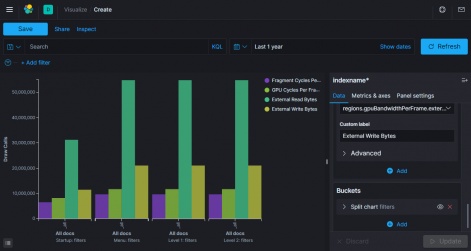
GPU and shader cycles and bandwidth per frame
Being able to split performance profiles in Mobile Studio by region helps you further categorise data, as shown below. By keeping an eye on the shader and GPU cycles, you can keep track of shader operation complexity, which can severely impact the frame rate and battery power usage on low-end devices. The read/write GPU bandwidth metric can assist in identifying areas in your game that depend too heavily on textures and render targets.
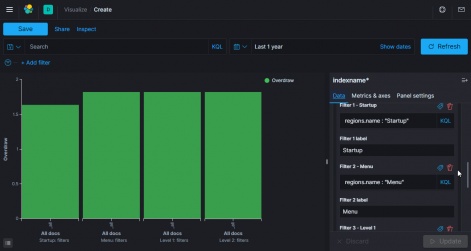
Overdraw per pixel per frame
Ideally, each pixel in a scene is only ever drawn once per frame for maximum performance, so an average value of overdraw significantly greater than 1.0 in this bar graph hints at room for optimisation in the object rendering of all scenes. Even a simple metric such as pixel overdraw can help tremendously in making sure your game or app runs optimally.
Choosing Metrics for Visualisation
You’ve now seen how visualisations like these ensure that everyone - from managers to developers to artists - can quickly see and understand how the current build is performing and take immediate action to fix performance issues that appear from automated testing.
The type of metrics you will want to track and analyse will depend on the game or app. A game with heavy graphics and special effects will likely focus on steady frame rate and shaders, while a game with AR camera features may be more concerned with battery power efficiency.
If you can anticipate the metrics you need, it will help you choose the optimal metrics for your project.
Next Steps
You've seen how to approach setting up automated builds, deployments, and performance testing in an Android device farm. You also saw the kind of amazing visualisations you can produce from the JSON data generated by the Performance Advisor.
Imagine how easily and quickly your team could identify and fix performance issues with automated testing. It could mean the difference between the next top game and the next flop game.
Ready to try it yourself? Get in touch with us and we’ll get you started.

")