As is often the case with Nintendo, its FY17 results contains all the information on how successful its mobile games have been, but some of that information has been obscured.
At the start of FY16, the company introduced a new consolidated sales category entitled “Smart devices, IP-related income, etc (*3)”.
(*3) tells us: “Includes income from smart-device content and royalty income”.
Peculiar grouping
Quite why smart device sales should be included with IP-related royalties remains uncertain.
And, to be clear, this category doesn’t include any royalty income from games such as Pokemon GO, which is handled separately within Nintendo’s financials. We can also see this as there’s no boost during the July to September Q2 period when that game was released.
However, given Nintendo first mobile release was Miitomo in March 2016, at least we get a baseline context to judge the impact of Super Mario Run and Fire Emblem Heroes’ performance.
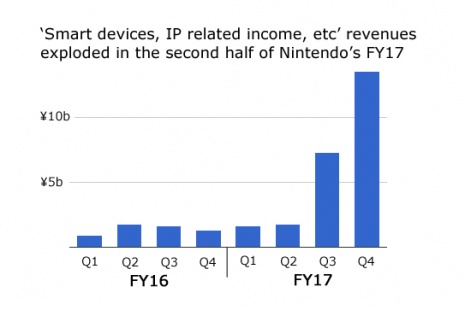
The obvious thing to from this simple graph of Nintendo’s “Smart devices, IP-related income, etc” category is very little happened until the period the three months ending 31 December 2016 (Q3).
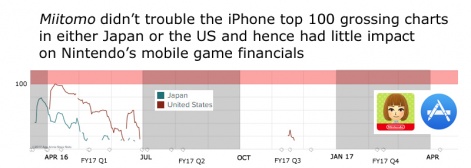
In that sense, the revenues generated by Miitomo can be ignored; something backed up if we considered its weak top grossing performance on the iPhone chart in key markets such as Japan and the US.
Instead, our attention is drawn to Nintendo’s Q3 and the launch of Super Mario Run on iPhone.
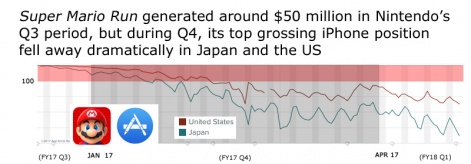
Derided at the time because of its one-time-only $10 IAP, nevertheless, the game was a top 100 top grossing iPhone title for over a month in January in Japan and until early February in the US.
Note, the US (and European) performance of the game was much stronger than in Japan.
In terms of Nintendo’s financials, Super Mario Run boosted the “Smart devices, IP related income, etc” category 314% in terms of quarter-on-quarter growth.
Reverse engineering
Of course, some of the sales recorded weren’t from Super Mario Run, but from Nintendo’s residual royalty business, which previously had turned-over around ¥1.7 billion (around $1.5 million) a quarter.
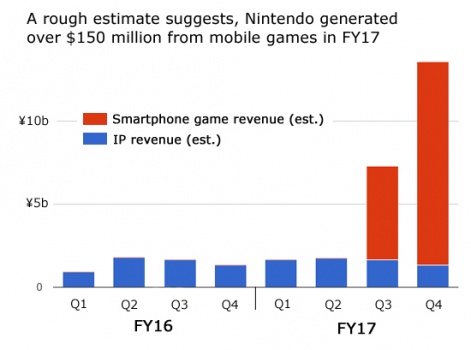
Crudely stripping this out of the Q3 category total of ¥7.3 billion on a pro rata basis, we get a figure of around ¥5.6 billion (or $50 million) for mobile game revenue during the Q3 period.
A similar assumption for the Q4 category total of ¥13.6 billion gives us a total of ¥12.2 billion (or $110 million).
That’s a total of $160 million for Nintendo’s mobile games over a six month period; something we can see reflected in the red components of the following graph.
(Note: some people are quoting a $190 million figure but this assumes all the revenue in this category is from mobile games, which isn't the case.)
More generally, the “Smart devices, IP-related income, etc” category accounted for 5% of Nintendo’s overall FY17 revenues, or 8% of Q4 revenue.
Reinforcements
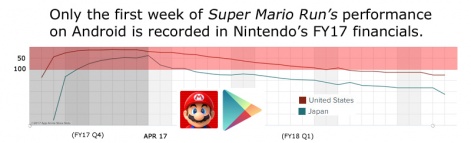
During the Q4 period, Nintendo also launched Super Mario Run on Android (March 23rd 2016) as well as Fire Emblem Heroes on iOS and Android (February 2nd 2017).
The Android version of Super Mario Run hasn’t been as successful as the iPhone version, either in terms of its peak grossing position or its sustained period within the top 100.
Also, because Nintendo’s financial period ended on March 31st 2017, only one week of its performance - albeit the game’s most lucrative period - is captured.
In contrast, Fire Emblem Heroes has maintained a top 40 grossing position since launch on the Japanese iPhone chart - including two months in the top 20 - and at least a top 80 position on the US chart.
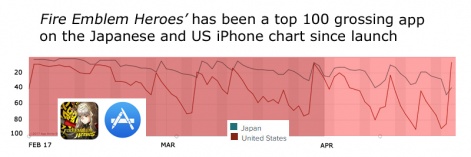
However, it should be noted that in both countries, the chart position has suffered from a lot of volatility. In the US, Fire Emblem Heroes has peaked at #8 and been as low as #91.
And, in contrast to Super Mario Run, Japan continues to be the strongest market for the game; we pointed out this was likely to be the case prior to launch.
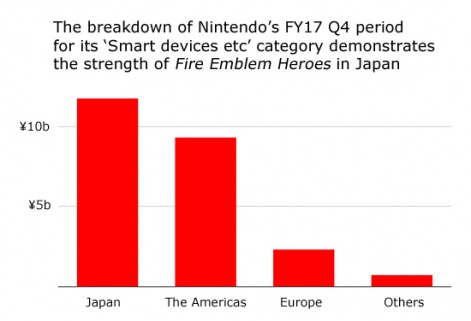
This is something that becomes apparent in the geographical breakdown of Nintendo’s “Smart devices, IP-related income, etc” revenues. For some reason, this is only provided for the Q4 period, but it clearly shows the level of Fire Emblem Heroes’ success in Japan.
Compare and contrast
In terms of estimating the revenue split between Super Mario Run and Fire Emblem Heroes, that’s impossible without access to more specific estimates of daily global revenues.
Nintendo hasn’t made any specific comparisons in its financials, but according to the Wall Street Journal, Fire Emblem Heroes’ revenue has now surpassed Super Mario Run’s.
That’s despite the fact Super Mario Run has been downloaded almost 150 million times. The total for Fire Emblem Heroes’ is likely to be less than 15 million.
Even so, Nintendo still only describes Fire Emblem Heroes’ performance as “satisfactory”, while Super Mario Run has been “disappointing”.
Which is an odd way to describe a business that’s generated more than $150 million in six months - or over $300 million if you include the indirect revenue generated by Pokemon GO via Nintendo's stake in The Pokemon Company.
But with Nintendo, nothing is straightforward.