Christian Henschel, the co-founder and CEO of adjust (formerly known as adeven), comes from a digital marketing background and now specialises in mobile analytics and app performance measurement.
In the highly competitive world of mobile gaming, understanding the LifeTime Value (LTV) of your users can be a challenging task.
But once you have it down, you will be one step ahead of the game in knowing which marketing channels best deserve your attention and marketing budget.
Simply put, the LTV of a user is their lifetime profitability, minus what it cost you to acquire them.
However, this is not a static number. Because the LTV changes and increases over the lifetime of a user, analytics are essential for knowing what is really going on.
Most importantly, measuring the LTV by looking at average churn or by attempting to measure the past revenue from churned users, makes it a lagging metric - and you only get slow feedback.
This can sometimes hide some very uncomfortable truths. Cohorts and proper lifetime analysis is critical if you want to compare apples with apples, and truly measure the profitably of your marketing channels.
True optimization
There are two main methods for projecting LTV, either based on modeling after certain events (suitable for when your data set is limited), or predictively, which is based on preliminary data captured at certain time points.
Whichever way you go, you can leverage your LTV by identifying which marketing channels are giving you the best results, and invest your time and money in these channels.
Let's imagine that you have a free-to-play game. Your LTV is variable, and is therefore probably one of your core metrics. You're looking partly to upsell, so to boost the LTV of existing users, and partly to acquire the users that are most likely to engage with your content.
The easiest, and most intuitive way of working this out is by calculating the average LTV from your users over a longer period of time and watching that metric as a single, straightforward KPI. If it moves upwards, good, and if downwards, bad. Easy.
For one of our gaming clients, this metric came out something like this:
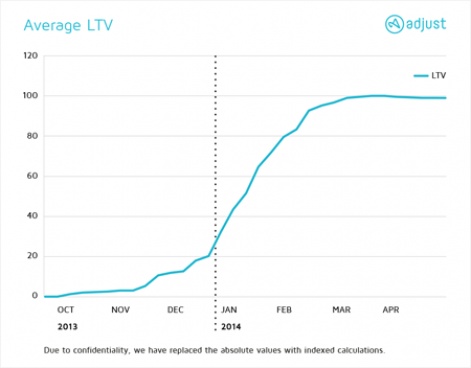
From the first glance, it looks pretty good. You can see that there is a period of strong LTV growth, as a result of successful optimization, which was followed by a plateau.
Looking at this metric, it seems like we've simply optimized LTV, and can move onto something else.
But, we can see this isn't the case by running another analysis on the same data.
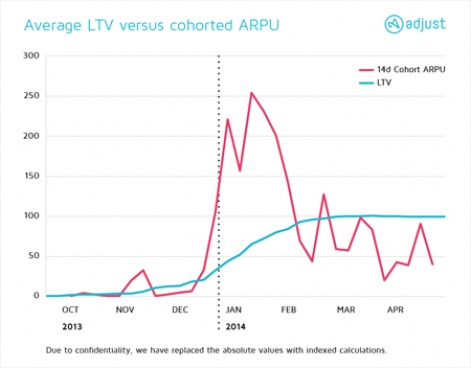
This graph shows LTV versus the cohorted, 14 day average revenue per user (ARPU). We see that the individual, early LTV is up to 2.5 times the extent of the maximum average LTV - and that it goes pretty far down, too.
That plateau wasn't LTV being optimised. The revenue of incoming users previously collapsed, meaning that new cohorts had dramatically lower LTV than users who installed a previous iteration of the app.
This crucial piece of information was completely fogged up by a flawed KPI in the first analysis.
This is how an effectively implemented cohort analysis allows you to calculate LTV at a much earlier stage and receive quicker, crucial feedback on your optimization, where a standard, retrospective average LTV may even hurt your analysis.