By Miguel Garcia and Beatriz Dominguez.
Here at LabCave, organic traffic growth has always been our main goal. In the early days of being developers, we found that all our work would be in vain if we did not get traffic that could position our app or even players to try our latest release.
This was an important lesson, we knew that we needed to find a way to get more organic traffic since acquiring most of our users wasn’t an option. Since then we have learnt from our experience and began to analyse the relationships between organic traffic and UA for many of our applications.
The relationship between organic traffic and UA is known as the k-factor. Many mobile marketers and companies talk about the existence of this relationship as a constant value, but this is not necessarily true. This value may or may not exist and be different based on several factors such as our campaign, our traffic, the countries or the season we are in.
Therefore, in order to get this k-factor, there is a lot of information to account for and a specific analysis needs to that take place based on each situation.
How can we analyse these relationships? What conclusions can we get from them?
At LabCave we conduct linear correlation analysis between organic installs and those coming from UA campaigns. We use the source and country statistics to find out if there is a high correlation factor between them.
We mustn’t use the app’s global data as each store works separately. Our positioning in each country is different and UA campaigns will have a distinctive effect: ranking in top 10 is not the same as ranking in top 100. This is one of many variables that can have impact on our traffic and can lead to a higher or lower k-factor in our UA campaigns.
The data analysis will tell us if the organic installs and UA installs are related. Based on this first conclusion we can see if it makes sense to find out the k-factor.
What data can we analyse?
We analyse organic search and browse traffic data separately. In our experience, depending on the campaign, this may affect one of them, both or have no effect at all.
For instance, if there is a TV advertising campaign for our app, where there is no link to our app, all installs will be organic traffic no matter where they come from. In these cases, we can determine how much of this traffic comes from the campaign and how much is really organic.
Besides, we can see how this traffic affects search but not browse. This may also happen to YouTubers or influencers campaigns. In order to be able to assign this part of the traffic to organic traffic, we need to have the campaign visualisation statistics data.
When campaigns work with links to the store for downloading the app later, some things get easier and others get more difficult for us. Now we can split data that comes from organic traffic from that coming from the campaign.
This also means a change in the analysis scope, as now we seek to establish a relationship between them in order to know how much organic traffic that campaign will generate.
What are our first steps to analyse our data?
We get two temporal series from organic installs and campaign installs statistics. We need them to be complete and with a significant amount of data.
When temporal series are not complete, we can use techniques to fill in the missing data, as well as work with “outliers” or “miss tracking”.

Once the data is ready, we can proceed with the following step. Our goal is to get the Pearson correlation coefficient and in order to do that we need our temporal series to meet the required conditions to conduct the analysis. We apply different tests to verify this and make sure we are doing the right things (more details to come in our next post).
Depending on these tests results, many times we will need to transform the series (for instance, make them stationary).
Let’s get our correlation coefficient, how can we interpret the results?
Once we have checked that all conditions have been met, we can proceed to get the correlation coefficient. We then try to find what the correlation is between both series day by day as well as in a 30 days lag so we can look for cross correlations on different days.
By doing this, we will get a result as in the following graph.
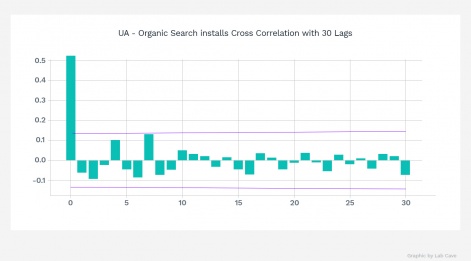
This graph will tell us in which lags there is a correlation and the sense of the relationship. In order to get a k-factor that affects the organic traffic we should always get a positive coefficient, meaning that the more installations coming from UA, the more organic installations we will get.
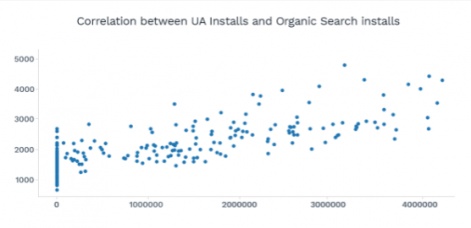
If the model results suggest there is a high correlation in a particular lag, we can plot UA installs against organic installs for that lag and see how they are related.
So what’s next?
So far we have been able to determine whether there is a strong correlation between campaign and organic traffic or not. If a correlation does exist, the following step is to quantify that relationship, in other words, get the k-factor.
At LabCave, we offer these studies to our customers and explain the results and conclusions. After analysing all these cases, we have gained a great deal of experience and it’s thanks to this experience that we have been able to improve and grow as a company.
This way, our customers will benefit from the information we can provide that will help them reach their own conclusions to grow their business.
On our next data post we will go into more technical details. See you then!

")