It's a mark of the global reach of the games industry and its maturity that during the just-ended financial reporting quarter (April-June 2014, which for most companies is FY14 Q2), we covered the dealings of 28 publicly-floated companies who have some part to play in the mobile games sector.
You can see the individual news reports here.
But to be honest, we could have covered more.
Only the difficulty of researching some of the more obscure Japanese and Chinese companies - often they don't report their figures in the English language - limited that total.
So what to do with all these numbers?
Some were news in their own right, of course: Zynga's continued decline; Glu's Kim Kardashian: Hollywood-inspired rise etc.
But across the entire sector, it's often hard to see the wood for the trees, which is why PocketGamer.biz is doing the hard-lifting for you, and including some pretty graphs in the process.
How big?
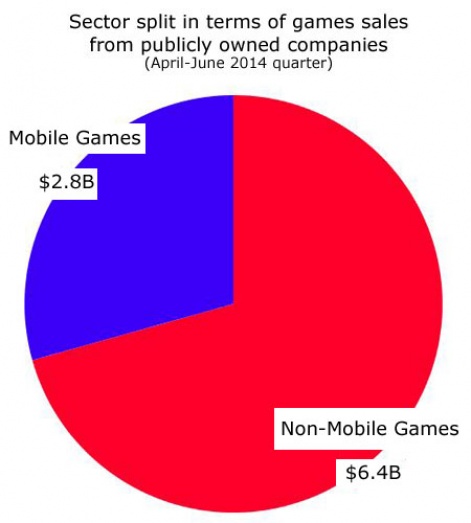
The place to start is to make a best guess at breakdown between the overall games industry and mobile's part of that pie.
Not all companies who have mobile sales directly break out those numbers. But if we roughly group companies into mobile and non-mobile majority companies, of the $9.2 billion of total game sales posted by publicly-owned companies, around $2.8 billion, or 30 percent, seems to come from mobile games.
Yet, we have to inject notes of caution at this point.
Obviously, a number of large game and mobile companies aren't publicly-owned; Kabam and Supercell being two prime examples, so the $2.8 billion and the $9.2 billion totals are smaller than the actual sectors.
(We haven't included platform holders like Sony, Microsoft or Nintendo either, not to mention the 30 percent margin taken by Apple or Google.)
Instead, our numbers come from the companies who legally have to announce their numbers because you can buy their shares.
More caveats
In addition, even for public companies, these numbers is likely to vary from quarter-to-quarter.
Despite the decline in retail game sales, the Holiday quarter (typically Q4) remains the biggest period for the likes of Activision Blizzard and EA. More generally, companies that focus on PC/console games experience clumpy quarters depending on when they launch their games.
For example, in this quarter, Ubisoft saw a 374 percent rise in year-on-year sales thanks to the release of the 8-million-selling Watch Dogs.
More subtlely, our total for mobile games includes some doubled-counted revenue that it's hard to strip out. For example, Tencent is the biggest 'mobile games' company but its revenue is a gross total from its platform.
So some of those millions of dollars that Tencent counts as sales will also be counted in the totals from companies such as EA Mobile and IGG, which published games via Tencent.
The big boys
Throwing caution aside, however, let's see how mobile and non-mobile games companies compare by looking at quarterly sales.
Tencent (just its game sales), EA and Activision Blizzard lead the rest, with quarterly sales approaching or over the $1 billion mark. Both Tencent and EA have also mobile game businesses. These accounted for 15 percent and 10 percent of their total game sales during the quarter.
Mobile games remain a tiny proportion of Activision Blizzard's sales,however: mobile and handheld games accounted for a mere 6 percent during the quarter.
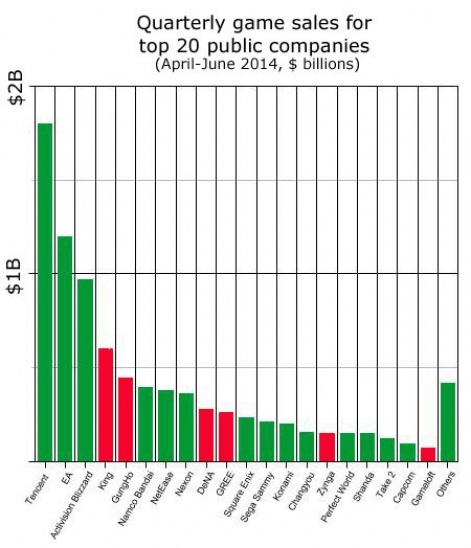
Interesting, the next band of companies - those in the c.$500 million range - are mobile-centric: in particular King and GungHo. A little further down the pecking order, 23 percent of Nexon's $361 million in sales come from mobile games.
At one time, the likes of DeNA and GREE would have posted c. $500 million quarterly sales, but both are now struggling to deal with the browser-game-to-native-game transition of the Japanese market.
Continuing down the list, there are a lot of Japanese publishers like Sega Sammy and Konami, which as well as console and mobile games business, also own amusement arcades and health centers. For example, of the $480 million that Konami posted in quarterly sales, only 44 percent came directly from games. We're only listing its game sales.
The mobile leaders
Looking in more detail at mobile-centric companies, there's no surprise to see King leading the pack. Of course, it splits its sales between mobile and Facebook, making Tencent the #1 mobile game company in this quarter.
Similarly, GungHo makes console games as well as mobile, but the vast bulk of its revenues come from mobile games, notably Puzzle & Dragons.
Those once all-powerful Japanese platforms GREE and DeNA are still relatively mighty in terms of mobile revenues, while Zynga - like King, a transitioned mobile-Facebook company - beats out EA Mobile in terms of sales.
Gameloft had a weak quarter, thanks to a lack of key releases, while in this graph, we're just listing Nexon's mobile sales - mainly browser games in Japan.
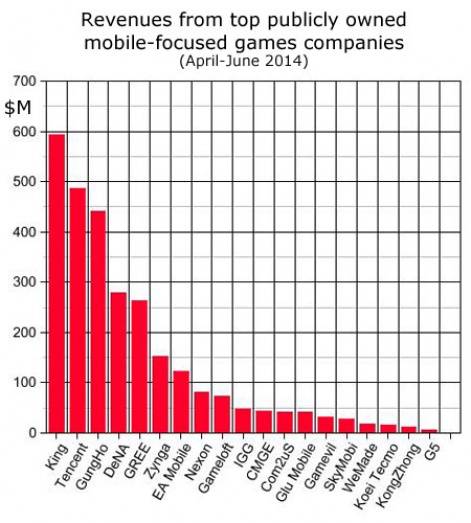
IGG is a company that may be new to many readers, by the Singapore-headquartered, Chinese-based (in terms of development) outfit has been one of the significant performers of 2014, thanks to the crazy success of its first-to-Android Clash of Clans clone Castle Clash.
Companies from China, Korea and Japan make up the remainder of our list, with the exception of Swedish-floated G5 Entertainment, which is the smallest company on our list.
On the up
Having ranked companies in terms of their sales, it's perhaps more important to look at which ones have been growing fastest in terms of sales.
The following graph gives us a view of the winners and losers in terms of the change in sales year-on-year.
Of course, it could be argued that for service businesses, the quarter-on-quarter change is more important, but prosaically, most companies list year-on-year changes so that's what we'll go for.
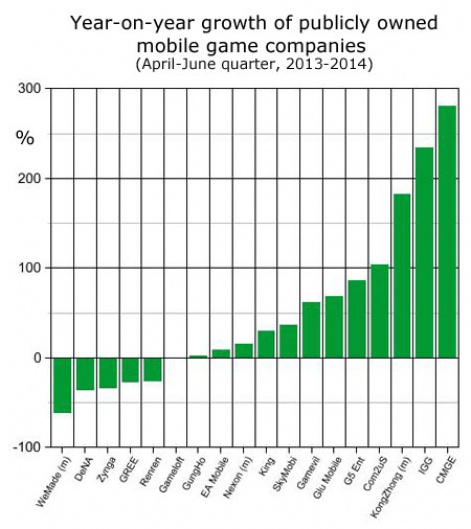
Starting with the losers, we've already covered the problems that GREE, DeNA and Zynga are struggling to deal with - the disruption of their previously core business. That's also the case for Renren. The 'Chinese Facebook' has been in freefall for a while now.
Korean publisher WeMade (the (m) means I'm just considering the trajectory of its mobile games sales, not the entire company) is somewhat different. Its year-on-year decline isn't structural; merely a reminder than 12 months ago, its Wind Runner game was a massive hit in Korea and Japan.
Looking at companies in the middle of the graph, they tend to be the mature players: Gameloft, EA and Nexon, which now find it hard to grow fast.
For King and GungHo, their lack of growth suggests that their key titles Candy Crush Saga and Puzzle & Dragons may have saturated the available playerbase and are now mature products.
Glu Mobile's growth came from a single massive hit - Kim Kardashian: Hollywood.
When we consider growing companies, Korean stalwarts Gamevil and Com2uS have been boosted by their highly lucrative domestic market, combined with strong international expansion plans.
Glu Mobile's growth came from a single massive hit - Kim Kardashian: Hollywood, while G5 Entertainment's growth is more structural: it canned all its paid mobile casual games and is now reaping the benefit of being a pureplay F2P company.
Finally, at the top end of growth - more than 100 percent - KongZhong and CMGE (China Mobile Game Entertainment) have managed to get hit games within the explosive Chinese mobile game market (2014 growth expected to be 90 percent), and - as discussed - IGG is powered by Castle Clash.
Efficient profiteers
You can spend a lifetime tricking yourself about the future prospects of shares using tricky financial ratios. That is not my aim, but I though it was worth spending a short time considering the standard margin/ratio of profit to sales.
This measures the ability of a company to generate profit from its sales, or conversely to control its costs.
Looking at mobile-centric companies, we can see that many of the companies with the highest year-on-year growth feature on this graph - notably IGG and CMGE. It easy to be highly profitable when you're growing fast.
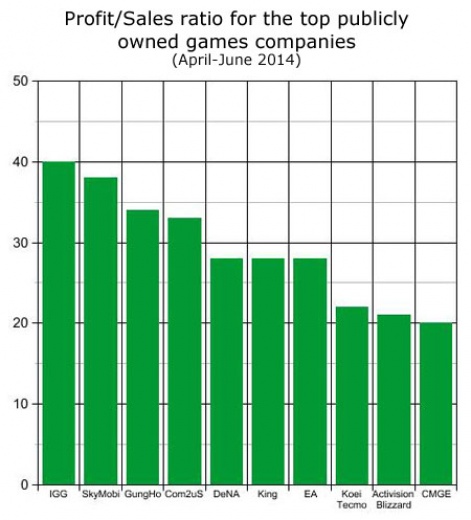
SkyMobi is a Chinese mobile game and app platform, which is moving aggressively into game publishing. As Tencent proves (and GREE/DeNA once proved) a successful platform business is very lucrative.
So it will be interesting to see whether SkyMobi can continue to operate a such a high margin as it spends more money promoting the games it's publishing.
Similar to the platform model, GungHo and King feature thanks to the incredible success they have had with Puzzle & Dragons and Candy Crush Saga; which have effectively been a licence to print money.
Perhaps more impressive, however, are the likes of Com2uS and EA (this is EA's entire business not just mobile), as this demonstrates a strong corporate approach to business.
Rainy day reserves
The final thing I wanted to consider was how much cash each game company had.
There are different ways of measuring this, so this is not an apples -to-apples comparison, but most companies will list how much cash and cash equivalents (i.e. highly liquid investments) they have.
These graphs of the most well funded companies gives some idea of how aggressively they can invest, whether that's launching new services and games, and/or acquiring rivals.
Looking at all game companies, Activision Blizzard's more than $4 billion cashpile is impressive - and the rumours suggest it may be looking to spend some of it, while Tencent's cash is for the entire internet giant, not just for the games division.
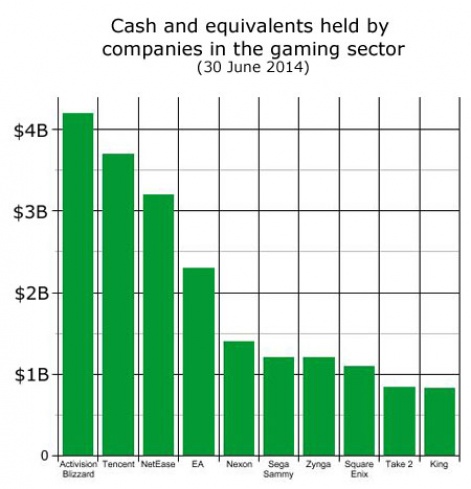
MMOG publisher NetEase is a surprising high cash company - it operates Blizzard games in China - while EA is another company that may be considering whether the best place for over $2 billion is its current account. Nexon has already been investing its cash hard.
In total, across all the company's we tracked, the total for cash and equivalent was over $23 billion.
Looking at mobile companies, despite being the butt of many jokes, and spending $527 million on NaturalMotion, Zynga still has a ton of cash, as do King and GungHo.
But the difference between King and GungHo is that they are generating over $100 million every quarter, whereas Zynga continues to lose money.
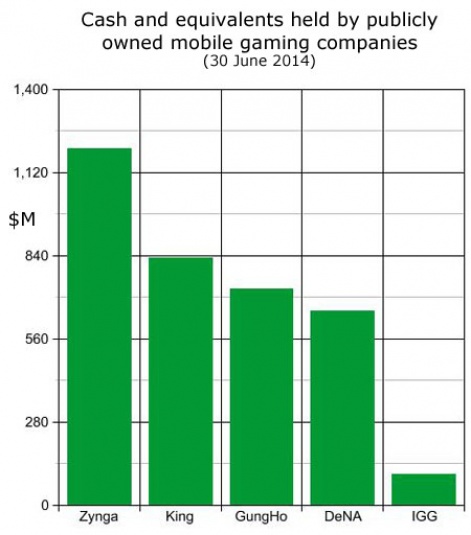
Still, you do have to do something with your money or the shareholders start to complain. For that reason, King announced a $150 million special dividend: not something many game companies choose to do.
One surprise - despite being hard on DeNA for its performance - it has a quiet a lot of cash available to it thanks to previous good years, while IGG is already building up its warchest with over $100 million in the bank.
N.B. As with many things we attempt on PocketGamer.biz, this data crunching of industry financials is something of a first-pass at a process we will refine over time.
As stated, different companies reveal different numbers, and different countries have different accounting standards, but wherever possible, we've attempted to be as sensible as possible in any assumptions used.
Of course, we hold no positions in any of the companies mentioned and nothing in this article should be taken as investment advice.
But you're too sensible for that, right?