Understanding your audience is crucial to a games success and knowing how that audience engages with your game can be incredibly important to retaining and satisfying players. If players are having a hard time finding the fun in your game, then they're likely to look elsewhere.
In this guest post, Azur Games lead analyst Alexey Platonov explains how heatmaps are underused in games development but should be used more often as a tool to gain a visual representation of player engagement.
Problem areas are magically exposed and can be corrected and simple quality-of-life improvements can create the best experience possible. Here's how.
Heatmaps are an intriguing and useful analytical tool, yet they're strangely underutilised, even by leading PC and console game developers. In the context of mobile games, their usage is even scarcer.
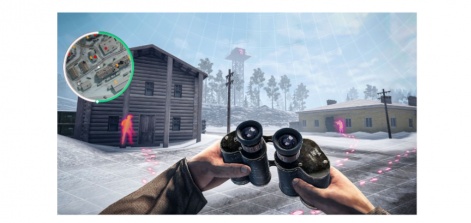
When I say heatmaps, I'm referring to a visual representation of player actions and coordinates: pathways navigated across a map, points of user interaction, sniper positions in shooter games, challenging trajectories in various locations, and so forth.
Heatmaps truly shine in mid-core projects. We occasionally use them in hyper-casual games, but we're more focused on UI/UX analysis. The main utility of this tool is to identify potential improvements in level design. This ensures that a game's progress isn't unexpectedly hampered by some non-obvious elements (like dead ends). Heatmaps can assist in enhancing metrics, visualizing weak points, and saving developers both time and substantial testing expenses.
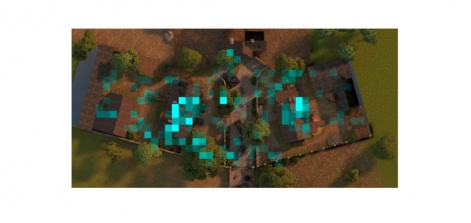
So how does it work? We receive analytical events from the game, including the player's coordinates at specific points in time and what the player is doing at those moments. This information can be overlaid onto a level map - usually taken as a standard screenshot in Unity or Unreal Engine - and allows for an examination of user movements and but also the frequency of different events at various points on the map. You can see an example of this below.
Our first experience
Our maiden venture into heatmap usage happened about 2.5 years ago with our mid-core online PvP shooter, World War Heroes.
When a new map was introduced in the game, we along with our level designers wondered about its actual balance. We initially conducted testing on a small group of players and detected a significant win rate advantage for one side. This prompted us to verify our findings using heatmaps. We were also eager to visually grasp player movement, the locations of most kills, the sites of frequent close combat, sniper positions, etc.
The thing is, not all issues are readily apparent from raw numbers. An analyst's role is not just about gathering these stats but also finding solutions and sometimes even identifying the problem itself, which might not be obvious to everyone else. This requires product knowledge, creativity, and independent thinking.
So, our initial use of heatmaps was an experiment to see if this tool could highlight something that we or the game and level designers may have overlooked.
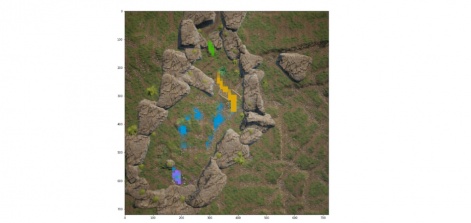
For instance, here's a narrow spot where players frequently died.
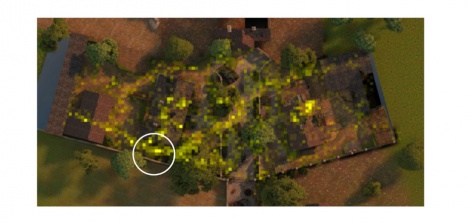
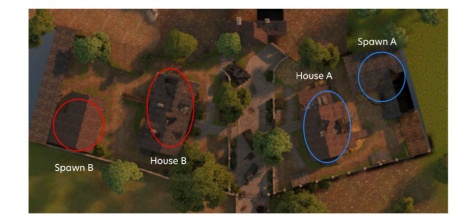
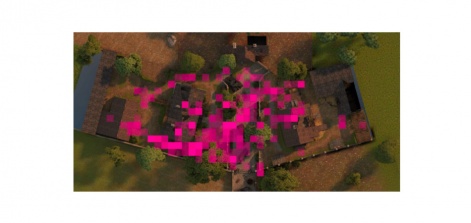
And this heatmap marks all the kills made with sniper rifles. It confirmed the level designers' initial assumption that the houses on this map are the best spots for snipers.
As a result, we discovered that heatmaps are a potent visual tool worth employing in future. Moreover, the initial implementation took just a few days, and subsequent analyses using heatmaps could be performed within hours.
Our key takeaways after this initial analysis were:
1. Players utilised all possible routes across the map.
2. Players gravitated towards routes nearest their spawn points.
- This led to some routes being underused, and a diagonal activity concentration from the respawn points.
- These less-traveled routes weren't ideal for placing ammo and/or medkits.
- Player activity could be redirected to underused routes by adjusting spawn points closer to these routes.
3. The left half of the map (team B's zone) saw more activity, providing an advantage to team A.
- The house on team B's side was slightly larger and it had a bottleneck (between the house and the fence) where most of the kills and movement occurred.
- In the open test data, team A demonstrated a higher win rate than team B (55% to 45%).
4. Players from both teams were more inclined to stay in their own half of the map than to venture into enemy territory.
5. The most effective weapons for this map were assault rifles, machine guns, and sniper rifles.
- Assault rifles were best suited for open areas (main streets and bypasses).
- Sniper rifles were ideal for in-house use to maintain distance.
- Machine guns proved effective both in open areas and indoors.
After WWH, we utilized heatmaps in a few more shooter games, where they indeed revealed some clear issues with map balance. Of course, not every project benefits from this method, as core mechanics and overall project look & feel still take precedence. However, analysts can use these tools to find opportunities for growth so that a good project doesn't lose players due to less-obvious issues.
The following case perfectly illustrates this point.
Enhancing gameplay with heatmaps
One of our mid-core projects, Off Road - an off-road driving simulator that features manual gear shifting, differential locks, and similar elements, greatly benefited from heatmaps.
This project didn't initially yield high metrics, and typical funnel analytics showed us that many players were quitting during the tutorial. This kind of behaviour usually indicates an off-target audience or technical issues causing game crashes at launch. However, neither of these seemed to be the case here. No clear reason for player drop-off could be discerned from these funnels alone.
So, we decided to investigate where players were encountering difficulties and brought heatmaps into play.
Given that Off Road is a simulator game providing a degree of free movement, the heatmaps quickly revealed instances where players were heading in the wrong direction, getting stuck, and ultimately abandoning the game. It became clear that the placement of checkpoints on the map was causing confusion, with some players simply not understanding where to go. The level design was inadvertently leading them astray.
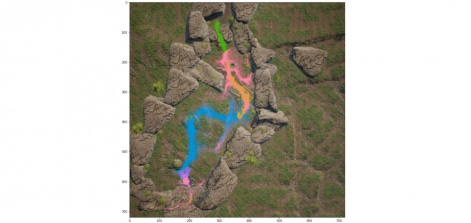
We then used the player routes from the heatmap, launched the game, and followed these paths ourselves, which made the things click into place.
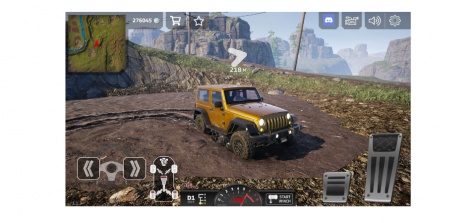
Here's a striking example.
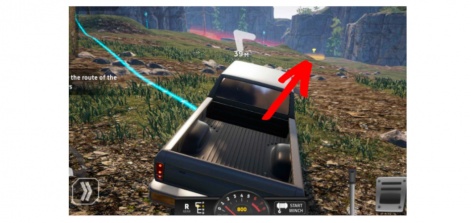
The screenshot depicts the player's perspective of the level. The red arrow points to the checkpoint - the player's target - while the white arrow and blue line illustrate the correct path to reach this checkpoint. However, 24% of the players saw the target, drove straight towards it, got stuck, and quit the game out of frustration. After all, why take a detour in an off-road simulator, right?
From a level design perspective, potential solutions could include obscuring the checkpoint with a mountain to prevent it from diverting players from the correct path or placing signs to guide players. An experienced product analyst, familiar with how the product functions, can readily propose these hypotheses.
Moreover, this kind of visual analysis via heatmaps is easily interpreted and provides clear indications of what and where improvements can be made - insights that wouldn't be gleaned from numbers alone. As a result, even a minor adjustment to the tutorial boosted the Day One retention rate by three percentage points. That being said, various other complex enhancements were still necessary.
The game is now updated regularly with a wealth of content, so heatmaps are continually in use. While there's no win rate balance here, the game greatly depends on how the gameplay is received by the players, necessitating consistent observation of player behavior in various environments.
Looking at traditional numbers alone, we wouldn't have been able to draw the same conclusions, nor make game modifications as swiftlyAlexey Platonov
Technical considerations for collecting analytics
When we initially used a heatmap for World War Heroes, we ran into several considerations that would be beneficial for anyone planning to use this tool.
The main point was that WWH was already sending us a significant amount of analytical data. We wanted to have all players send their locations every five seconds to achieve maximum granularity in the coordinates of player movements. However, when we evaluated the potential growth in the number of events, the size of the database, and the frequency of queries, it became clear that inundating the data with coordinates was not an optimal solution.
After much deliberation, we settled on two alternatives.
The first approach involved sending events to a certain percentage of players (around 10%). However, the sheer volume of players was still too high (even when we attempted to lower the percentage), leading us to abandon this option.
The second approach became viable when the WWH team utilised beta testing extensively. They had a separate server with a core, engaged audience that had first access to new maps. This worked remarkably well. With a smaller player base, we could afford to send the necessary events to everyone every five seconds. I highly recommend this method.
For Off Road, we also moved towards this second approach. The decision wasn't influenced by the genre of the game but by the size of the project. If the project grows and the player base expands, the number of events sent can become overwhelming. Using separate servers for beta testing not only helps manage this issue but also allows us to polish the maps prior to a full update release.
Another minor complication involves the scaling and overlay of heatmaps on the level screenshot. While the screenshot is straightforward to capture within the game engine, it's more challenging to align the transmitted coordinates with the screenshot, correctly adjust the scale for readability, and choose the appropriate angle. At times, I found myself recalling lectures on analytic geometry and algebra.
While this isn't exactly a technical issue, there will certainly be some tweaking of the size sliders. It's usually a bit tricky the first time around, but it becomes easier with practice.
Currently, we're experimenting with animated GIFs that visually demonstrate player movement (either individually or collectively) across the map. However, these are more cosmetic enhancements.
Development
Our team created the heatmap tools with just one lead and a few additional contributors. Now, the system is in place and accessible to all. The one caveat is that interpreting the final data requires not just the skill to build heatmaps but also product expertise. It's crucial to be able to decipher the data yourself rather than merely handing over raw graphs to game designers.
It's beneficial when analysts can propose hypotheses, interpret what they see, and suggest solutions to other departments; this is highly valued.
Regarding the initial development of the tool, creating events on the client side is just a couple of hours work for a programmer, including the time to capture a suitable level screenshot.
The main work lies with analytics. Over the course of the experiment, we added functionality in several iterations, enhancing the readability of the maps to ensure the tool could be effectively used in the future. We completed this in a week, excluding the wait time for an update with new events to be released. In total, it took about two weeks.
Now, the whole process of collecting and analysing data takes merely 1-2 days to process everything, verify that the data is coming in correctly, and check the data itself. One additional day is needed to draw conclusions.
Returns
In terms of returns, the use of this tool has been entirely worthwhile. Looking at traditional numbers alone, we wouldn't have been able to draw the same conclusions as we did with Off Road, nor make game modifications as swiftly.
As for alternatives, perhaps you have a substantial team of QA specialists. And if you don't? One option could be hiring third-party testers who record their gaming sessions. However, not all of them possess product knowledge, so analyzing the footage and identifying patterns would be time-consuming (not to mention costly).
Ideally, an analyst should be able to save time for the QA department, level designers, and ultimately, the entire team, thereby boosting their productivity.
The greatest strength of an analyst lies not in number-crunching but in their ability to say, "it works this way, so let's try this and expect these results." For a junior analyst, mastering the tools and hard skills is vital. But a senior analyst operates at a higher level, tackling problems with unknown solutions. They find a way to solve them. Heatmaps are a valuable tool for this purpose, particularly when other methods fall short.
Edited by Paige Cook