Ioana Hreninciuc is the CEO of GameAnalytics.
While there has been a lot of talk about the emergence of hyper-casual gaming and the broadening of the audience for mobile games to ever-more casual players, data shows that high spenders are investing more than ever before.
Using our new platform, Benchmarks+, we can analyse how the main gaming categories and genres have performed for daily ARPPU (Average Revenue Per Paying User) across 2019 and all the way back to 2016.
For this recent analysis, our key focus is the top 5% quantile for this metric, as this is where we would see spending comparable to "whales". All revenue is IAP based and daily ARPPU values are averaged to weekly data points.
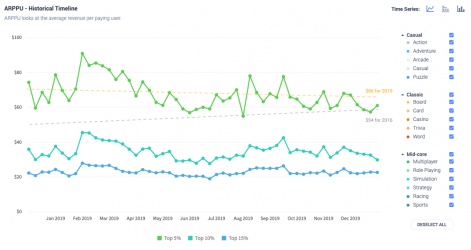
What we see is daily ARPPU (Average Revenue Per Paying User) at the top end of the scale growing by 20% over the last three years - an increase in almost $12 per player, per day.
Daily ARPPU has increased by around 20% since 2016

As we can see in this chart, the top 5% of cvalues across all genres currently sits at around $66 on average. But despite this growth in spend amongst the very highest spenders, the top 25%, median, and bottom performers have remained the same. This essentially means that players already spending big are prepared to spend even more, but they're not necessarily doing so in a wider pool of titles.
We can also see that there is a sizable variance in the amounts players are spending in-game. The gap between the top 5% and the top 10% is almost double. What this means is that the best performing (top 5%) of games might see a daily ARPPU as high as $70, whereas the ARPPU of games in the top 10% drops to around $35-40 per day.
But let's not forget to put this kind of spending into context; according to our H1 2019 analysis, published towards the end of last year, showed the median ARPPU across all F2P games is $6. What we are looking at here is the behaviour of a very small segment of players - but ones which continue to have a disproportionate impact on revenues.
What does spending look like for each gaming category?
We all know there can be big differences in spending habits across game genres. With this in mind, we reviewed the ARPPU for the Casual, Classic, and Mid-Core categories, sharing how this trend varies across different game types. Let's start with casual games.
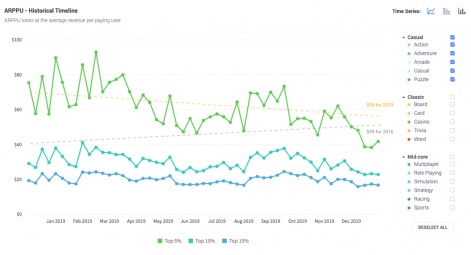
The top 5% of "Casual" games have an ARPPU of $50-$60

Between H2 - 2018 and H1 - 2019 the ARPPU for the top-performing Casual games was at an all-time high. We believe this was a result of the hyper-casual boom and the sheer number of players this genre was bringing in. As we can see, the 'peak' ARPPU nudged towards $100, but in the second half of 2019, this began to show signs of stabilising more towards the "normal" levels of previous years. This could be a reflection of an ever more ad-focused approach, but also of the increased competition in the casual space.
Looking at the most recent months, the ARPPU has dropped to around the $60 mark. Whilst this is quite a drop compared with the start of the year, it's still $10 more than our average from 2016. It will be interesting to see what happens in 2020 and whether we see a resurgence in hyper-casual monetization.
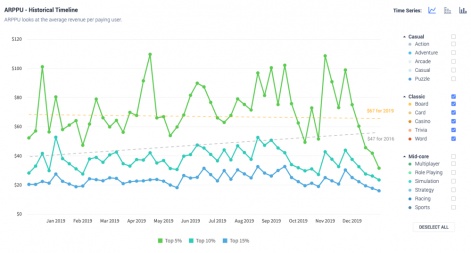
The daily ARPPU of "Classic" games has increased by 35%

Looking at the data, the best performing Classic games consistently achieved a daily ARPPU of $60 upwards throughout 2019 - an increase of $20-30 compared to 2016. The top 10% has increased by up to $10, and the top 15% increased by $5. This means that high spenders are parting with more cash in the classic titles, across a larger range of games.
These types of games (word puzzlers, solitaire, chess etc.) are popular across all age groups and demographics, including older players with more disposable income, which might account for the increased spending.
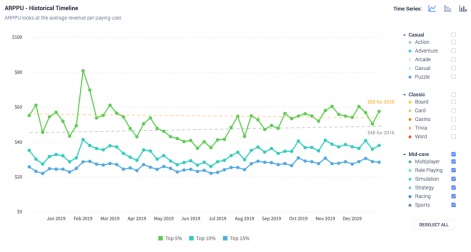
The daily ARPPU of the best "Mid-core" games is between $50-60

When we look at the data for games in the Mid-core category (which includes strategy, sports and RPG titles) we can see the quantile variance is less pronounced than it is for the other categories.
The top performing 5% of mid-core games are still seeing up to 3x better monetization than the top 25%, but this is not as big a difference as we can see with Casual and Classic games. Overall, the closeness of these performance quantiles shows that mid-core games are better at converting across the board, with a greater focus on IAP - even in this age of ad-based monetization.
Since 2016, the top 5% ARPPU has increased slightly, by about $5-10, but it's striking that the kinds of games that many people think would be the most appealing to high-spending players have not seen the same increase in spending as in other categories. This likely reflects that mid-core titles were always relatively successful at converting players, whereas the other more casual type games are catching up, as well as bringing on more players than ever before.
In summary
From the data, we can see that the mobile games market is changing at a quicker rate than ever before. Hyper-casual gaming clearly boomed last year, but that explosive impact has subsided and now might be evolving into something quite different, and it will be interesting to see if other game categories undergo similar disruption in 2020.
As more people play mobile games than ever before, we might have expected a flattening in ARPPU. In fact, the growth in ARPPU shows that players are more engaged in the games they play than ever before, and developers are becoming ever-more skilled in creating games that can encourage such high levels of dedication, competition and loyalty.
GameAnalytics has recently launched Benchmarks+, a mobile intelligence tool for the games industry with a huge scale of global data. Their platform includes aggregated insights for each KPI across 1.2 billion players, 16 billion sessions and 150 million transactions each month.


