Tenjin and GameAnalytics have released their hypercasual benchmark report for Q4 2022, examining the state of mobile advertising in the genre.
Median CPI (Cost Per Install) for the genre hit an all-time high on both Android and iOS with Android rising $0.05 to $0.20 while iOS rose $0.17 to $0.42, more than twice the cost. This suggests that recent IDFA changes have hit iOS hard, forcing marketers and game makers to spend more money than ever before on user acquisition.
The United States dominated ad spend for the quarter on both iOS and Android devices, suggesting that the high LTV (Lifetime Value) potential of US consumers remains a major draw for developers and marketers, although a lower LTV may well be offset by a higher number of users. However, the median CPI in the USA tops the charts on both app stores suggests that marketers are struggling to translate this high ad spend into downloads.
However, median CPI in the US fell $0.06 on iOS, while no country saw a decrease on Android platforms.
Interestingly, Japan proved to be a prime target on both platforms, Seeing the second highest ad spend on iOS and third highest on Android. Despite the fact that Japanese consumers have been slow to adapt to mobile technology, hypercasual dominates the country’s download charts. However, the genre struggles to engage Japanese consumers, with a Liftoff report from last year showing that only one percent of playtime was spent on the genre.
Low CPI is key
The lowest CPI in the top ten countries by ad spend varied depending on platform, but in both cases was a mobile-first market. China saw the lowest CPI on iOS, with $0.21, while Android had several territories with a lower median CPI: Brazil ($0.07), Mexico and Indonesia ($0.06 each), and India ($0.03). However, it should be noted that the Google Play store isn’t available in China.
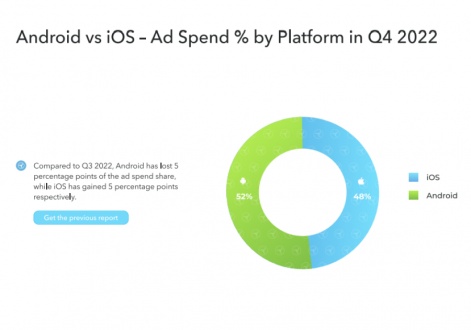
Android saw a slim majority of 52 percent of ad spend over the period, compared to 48 percent on iOS. This represents a fall of five percent spent on Android, suggesting that iOS developers may be spending more money due to recent IDFA changes.

Despite the increasing difficulties of effective user acquisition on iOS devices, it appears that there may be a lower churn rate among top performing games on Apple devices. The report notes that the top two percent of games have a 45 percent day one retention rate on iOS devices, compared to 38 percent on Android.
While retention rates are lower on day seven, iOS still pulls ahead by five percent, at 19 percent compared to 14 percent on Android. This suggests that, despite the lower ad spend and CPI on Android platforms, iOS remains competitive due to the comparative LTV of users.
A Tenjin and InMobi report published in December examined the shirt-term effects of Google’s new ad policy.


